
Work with Analytics charts and exports
Each report starts with a chart. This article explains how to read it and how to export charts and tables.
Read a chart
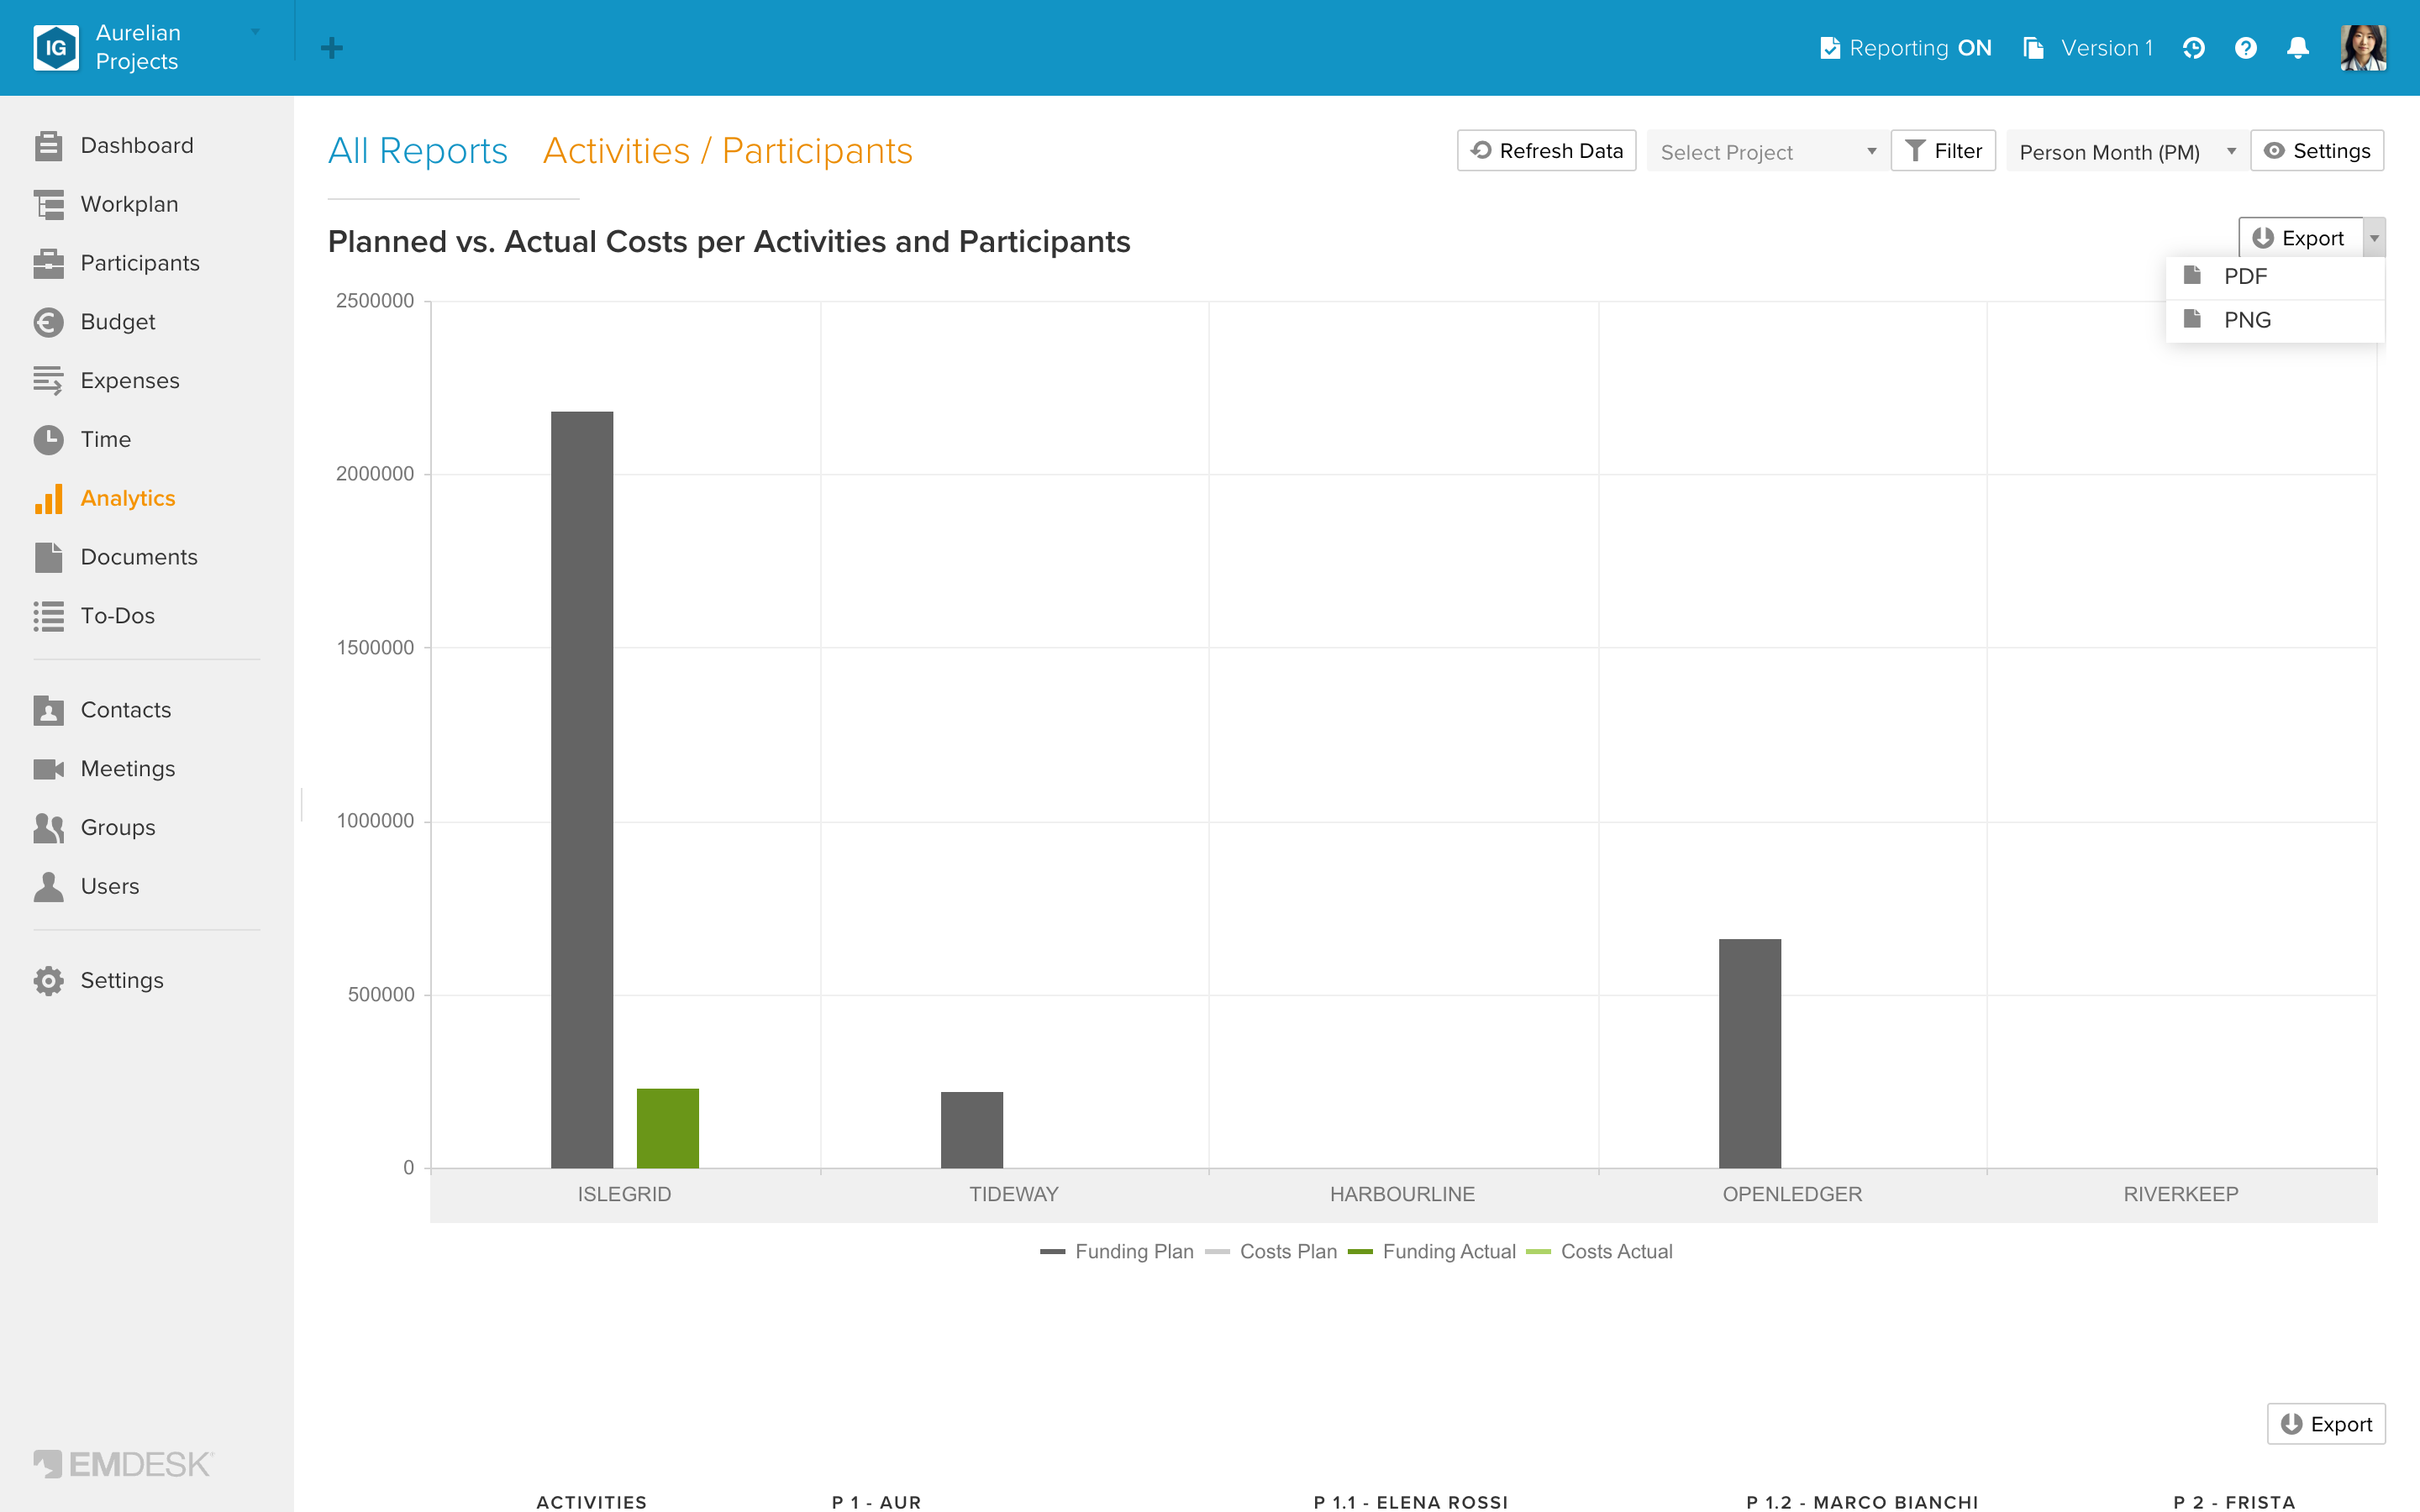
- Each category (a participant, an activity, a period) has two stacks: Plan and Actual.
- In the Time reports and "Activities / Participants", Plan is grey and Actual is green. In the cost charts each stack shows the funded part in the darker shade and the rest of the costs in the lighter shade.
- In the other reports each stack is divided into parts, for example by activity type, cost class or personnel cost rate. Plan is drawn in grey tones; in "Participants / Activity-Types" it uses lighter shades of the activity type colours.
- The legend sits below the chart. In the cost charts it reads Funding Plan, Costs Plan, Funding Actual and Costs Actual. In the effort charts of the Time reports and "Activities / Participants" the legend reads Costs Plan and Costs Actual, one colour each.
- The Time reports and "Activities / Participants" draw vertical columns. The other four reports draw horizontal bars.
The chart follows your filters and Settings. See "Filter Analytics reports" and "Analytics view settings".
Change the level
If your participants or activities form a hierarchy, open Settings and choose a level under Show level (charts). The first entry, for example Project, shows the top of the structure; the other entries show the sub-items.
Export a chart
Click the small arrow next to the Export button above the chart and choose PDF or PNG. The file is named chart-export.pdf or chart.png. Chart export is not available on the Free plan; EMDESK shows the upgrade dialog instead.
Export a table
Click Export above a table. EMDESK creates an Excel file (.xlsx) whose name starts with "Export". The file contains what you see: the columns you switched on, the funding lines if shown, and without blank rows if Hide blank columns/rows is on.
If the exported numbers differ from another export, see "Why Analytics figures can differ from Budget and Expenses".