Read the figures in an Analytics table
Every Analytics table compares Plan (your Budget) with Actual (your Expenses). This article explains the columns, the colours, the totals and how to see the entries behind a number.
- The columns
- Colours and number format
- Totals
- Expand rows
- Funding rows
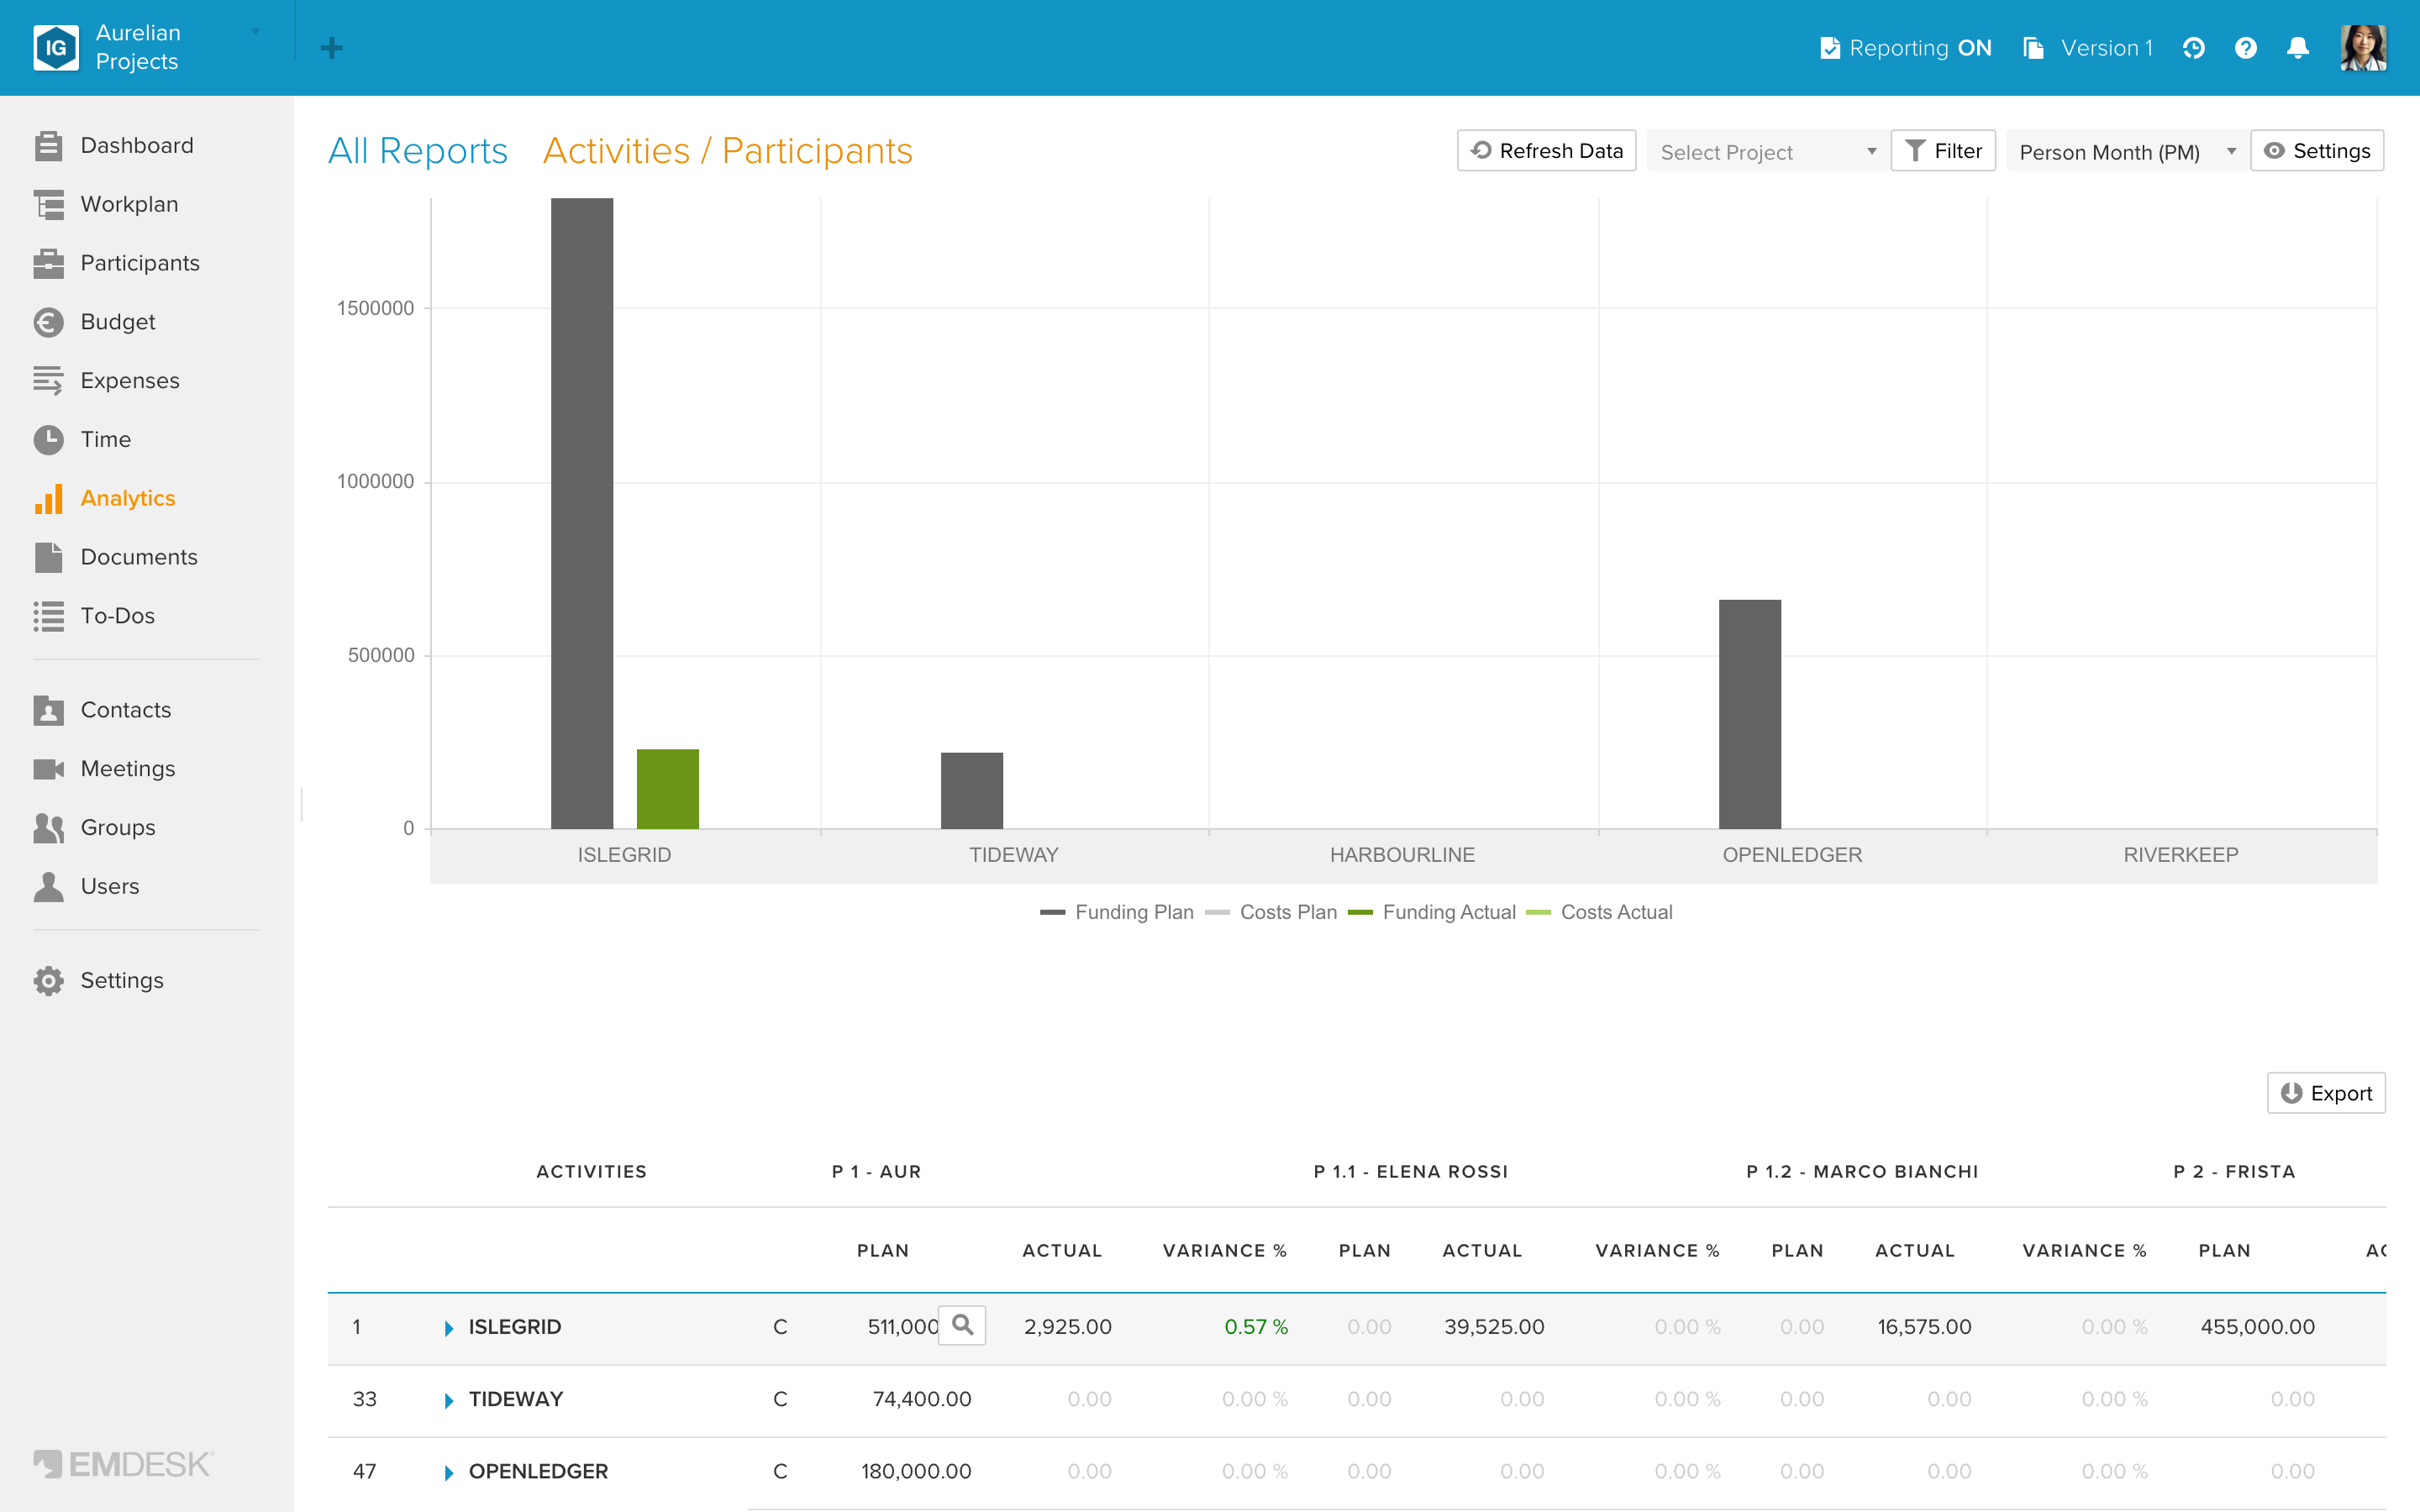
- See the entries behind a number
The columns
| Column | Meaning | Shown by default |
|---|---|---|
| Plan | The budget for this row and column | Yes (setting "Show Plan") |
| Actual | The expenses for this row and column | Always |
| Variance Abs | Plan minus Actual. A positive number means money is left. | No (setting "Show Variance") |
| Variance % | Actual as a percentage of Plan. 80 means 80 % of the budget is spent. It shows 0 if the Plan is 0. | Yes (setting "Show Variance in %") |
| % of Total Plan | The Plan of this column as a share of the row's total Plan | No |
| % of Total Actual | The Actual of this column as a share of the row's total Actual | No |
Switch the optional columns on and off in "Analytics view settings".
Colours and number format
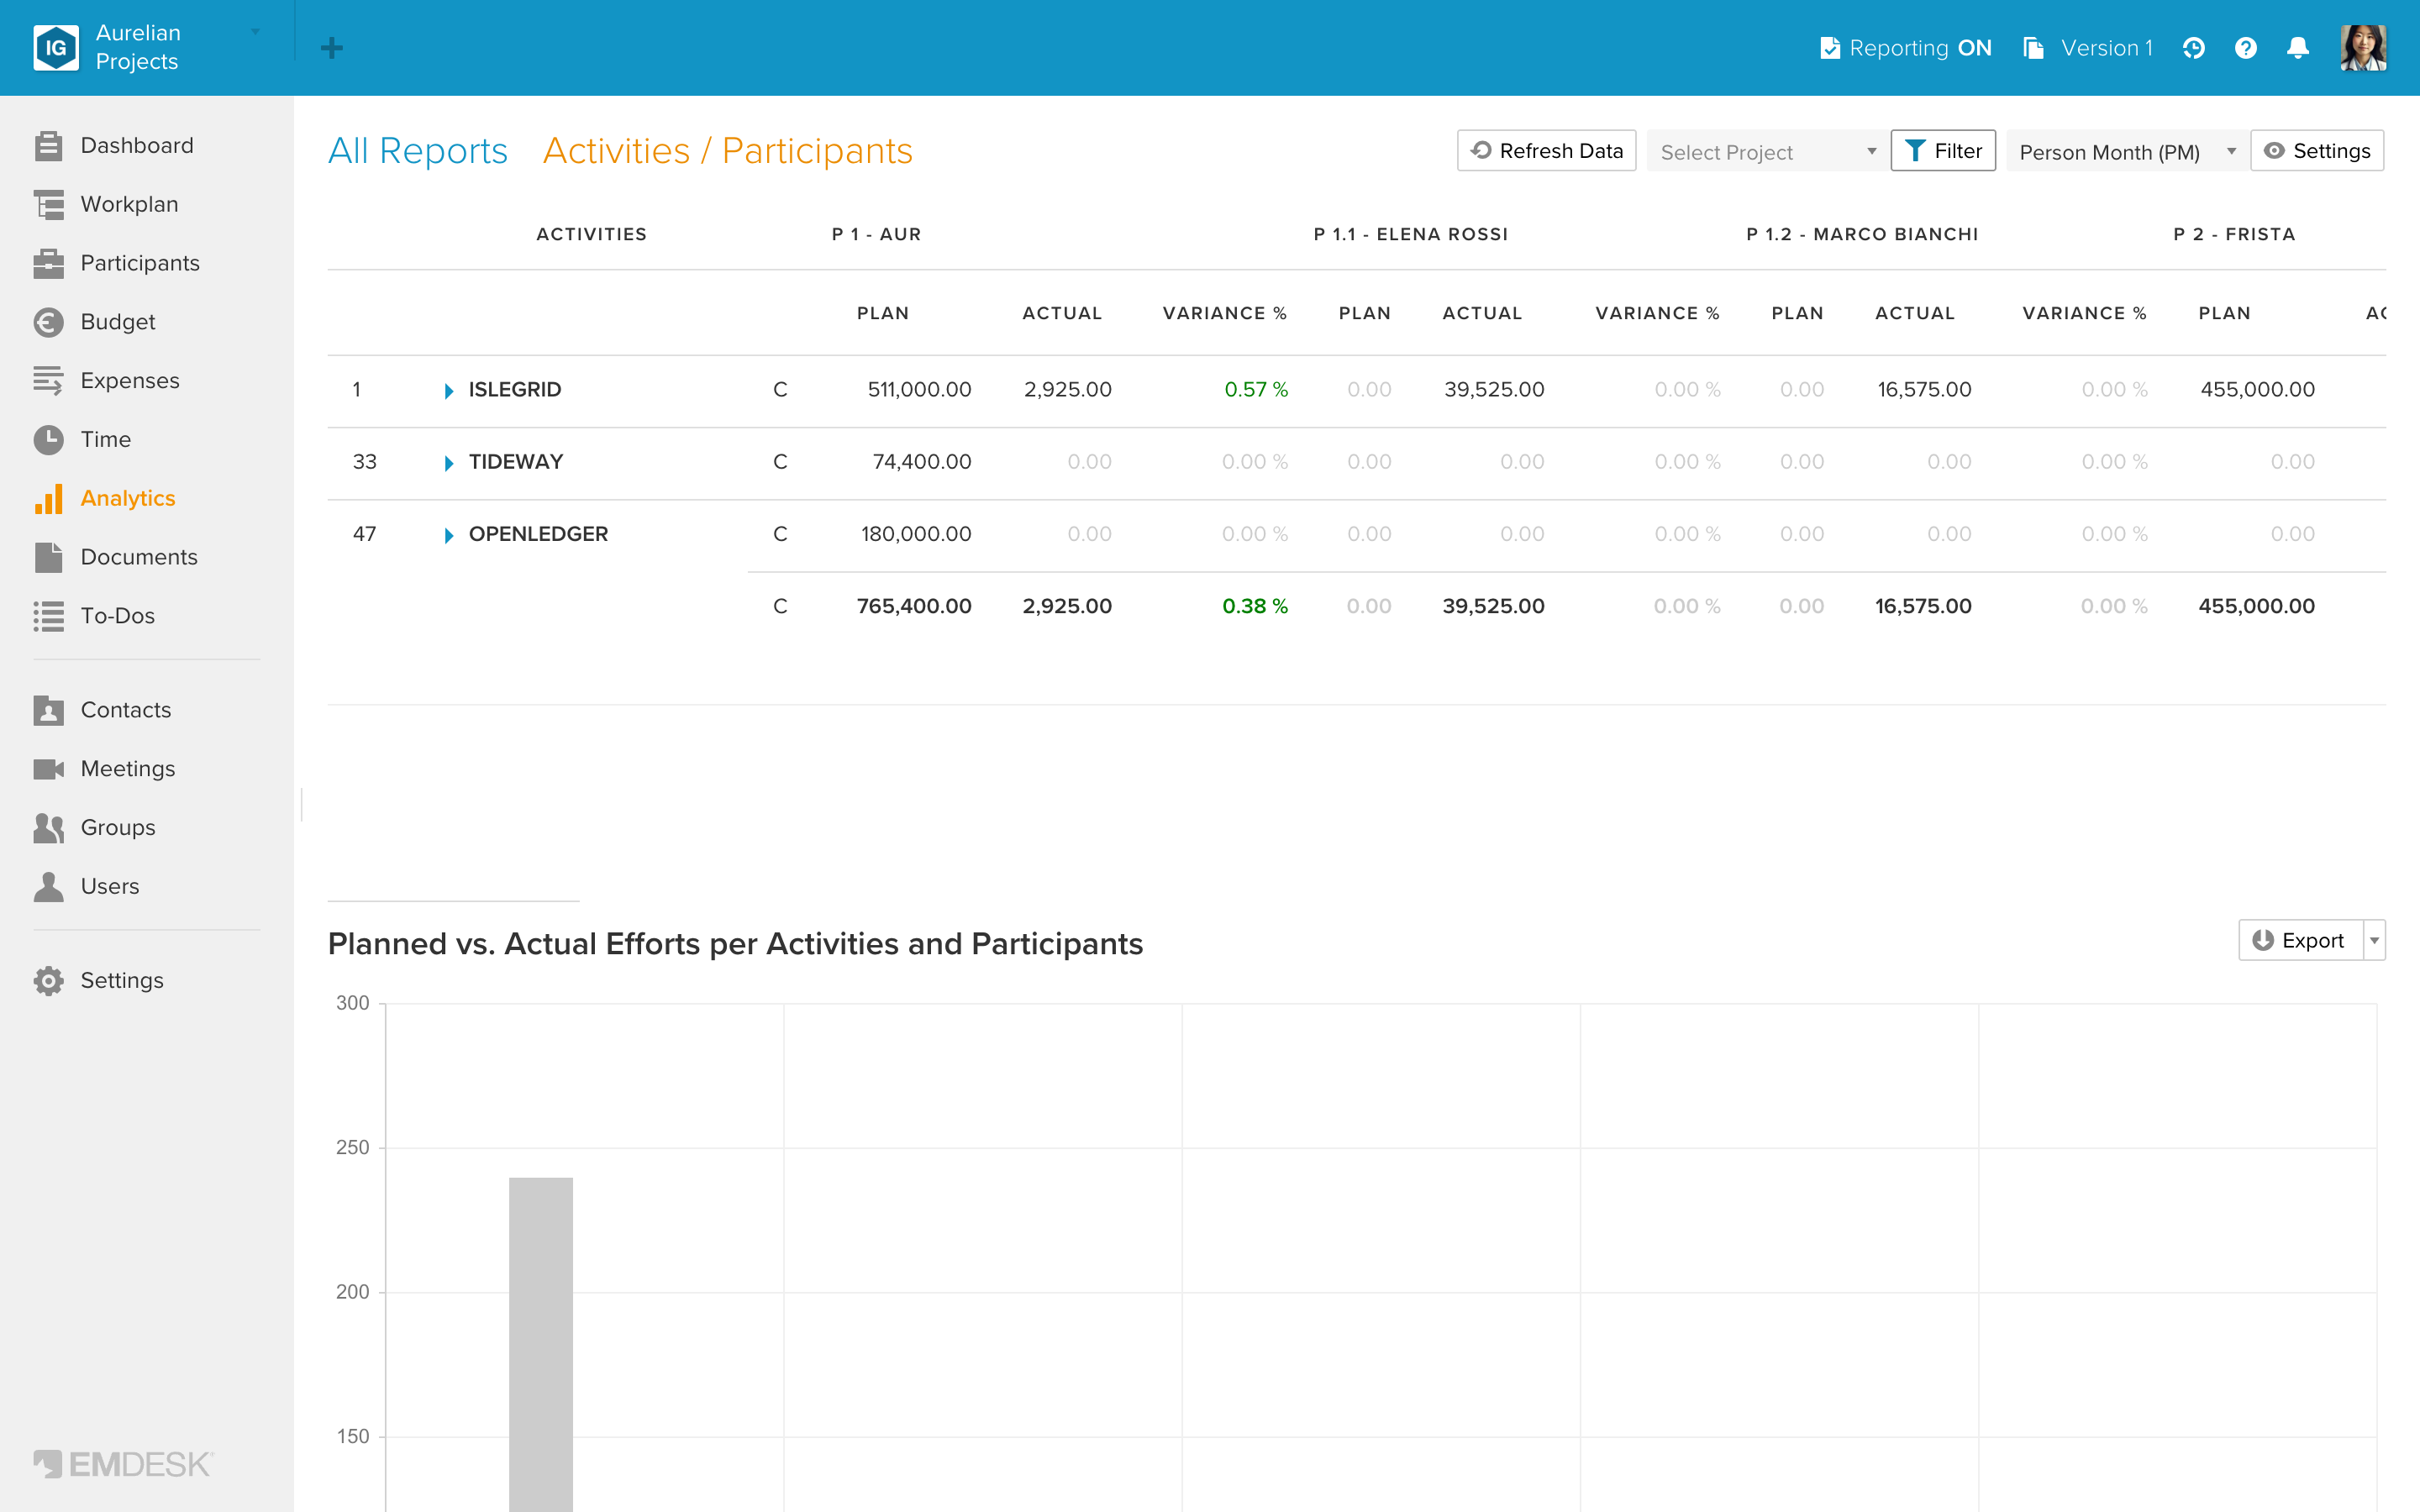
- Variance Abs is green above zero (under budget) and red below zero (over budget).
- Variance % is green from 0 up to 100 and red above 100 (over budget).
- Zero values are shown in a lighter tone.
- Numbers show two decimals. Hold the pointer over a number to see more decimals.
Totals
The last column Total adds up each row across all columns. The grey row at the bottom adds up each column across all rows. The Total cells in this row and column are not offered for the two "% of Total" columns.
Expand rows
A row that has sub-items has an arrow. Click the row to show or hide its sub-items. EMDESK remembers which rows you opened, per report and per tab. The setting Accumulate subtotals (on by default) adds the figures of the sub-items to their parent row. If you switch it off, a parent row shows only what is booked directly on it.
Funding rows
If your workspace has funding rules, Show Funding in the Settings adds a second line per row. Cost tables always have a small column that labels the lines: C for costs and F for funding, which is the funded part of the costs according to your funding rules. The F line appears only with Show Funding.
See the entries behind a number
Next to a Plan or Actual number above zero, a small magnifier button appears when you hold the pointer over it. Click it to open Budget (for a Plan number) or Expenses (for an Actual number) with the filters of that cell already set. This works in all reports except the two Time reports, and not for Variance columns.
If the numbers there do not match, read "Why Analytics figures can differ from Budget and Expenses".