
Analyze budget and expenses over time
The reports "Participants / Time" and "Activities / Time" show Plan and Actual per period. Use them to see when money was budgeted and when it was spent.
Choose the interval
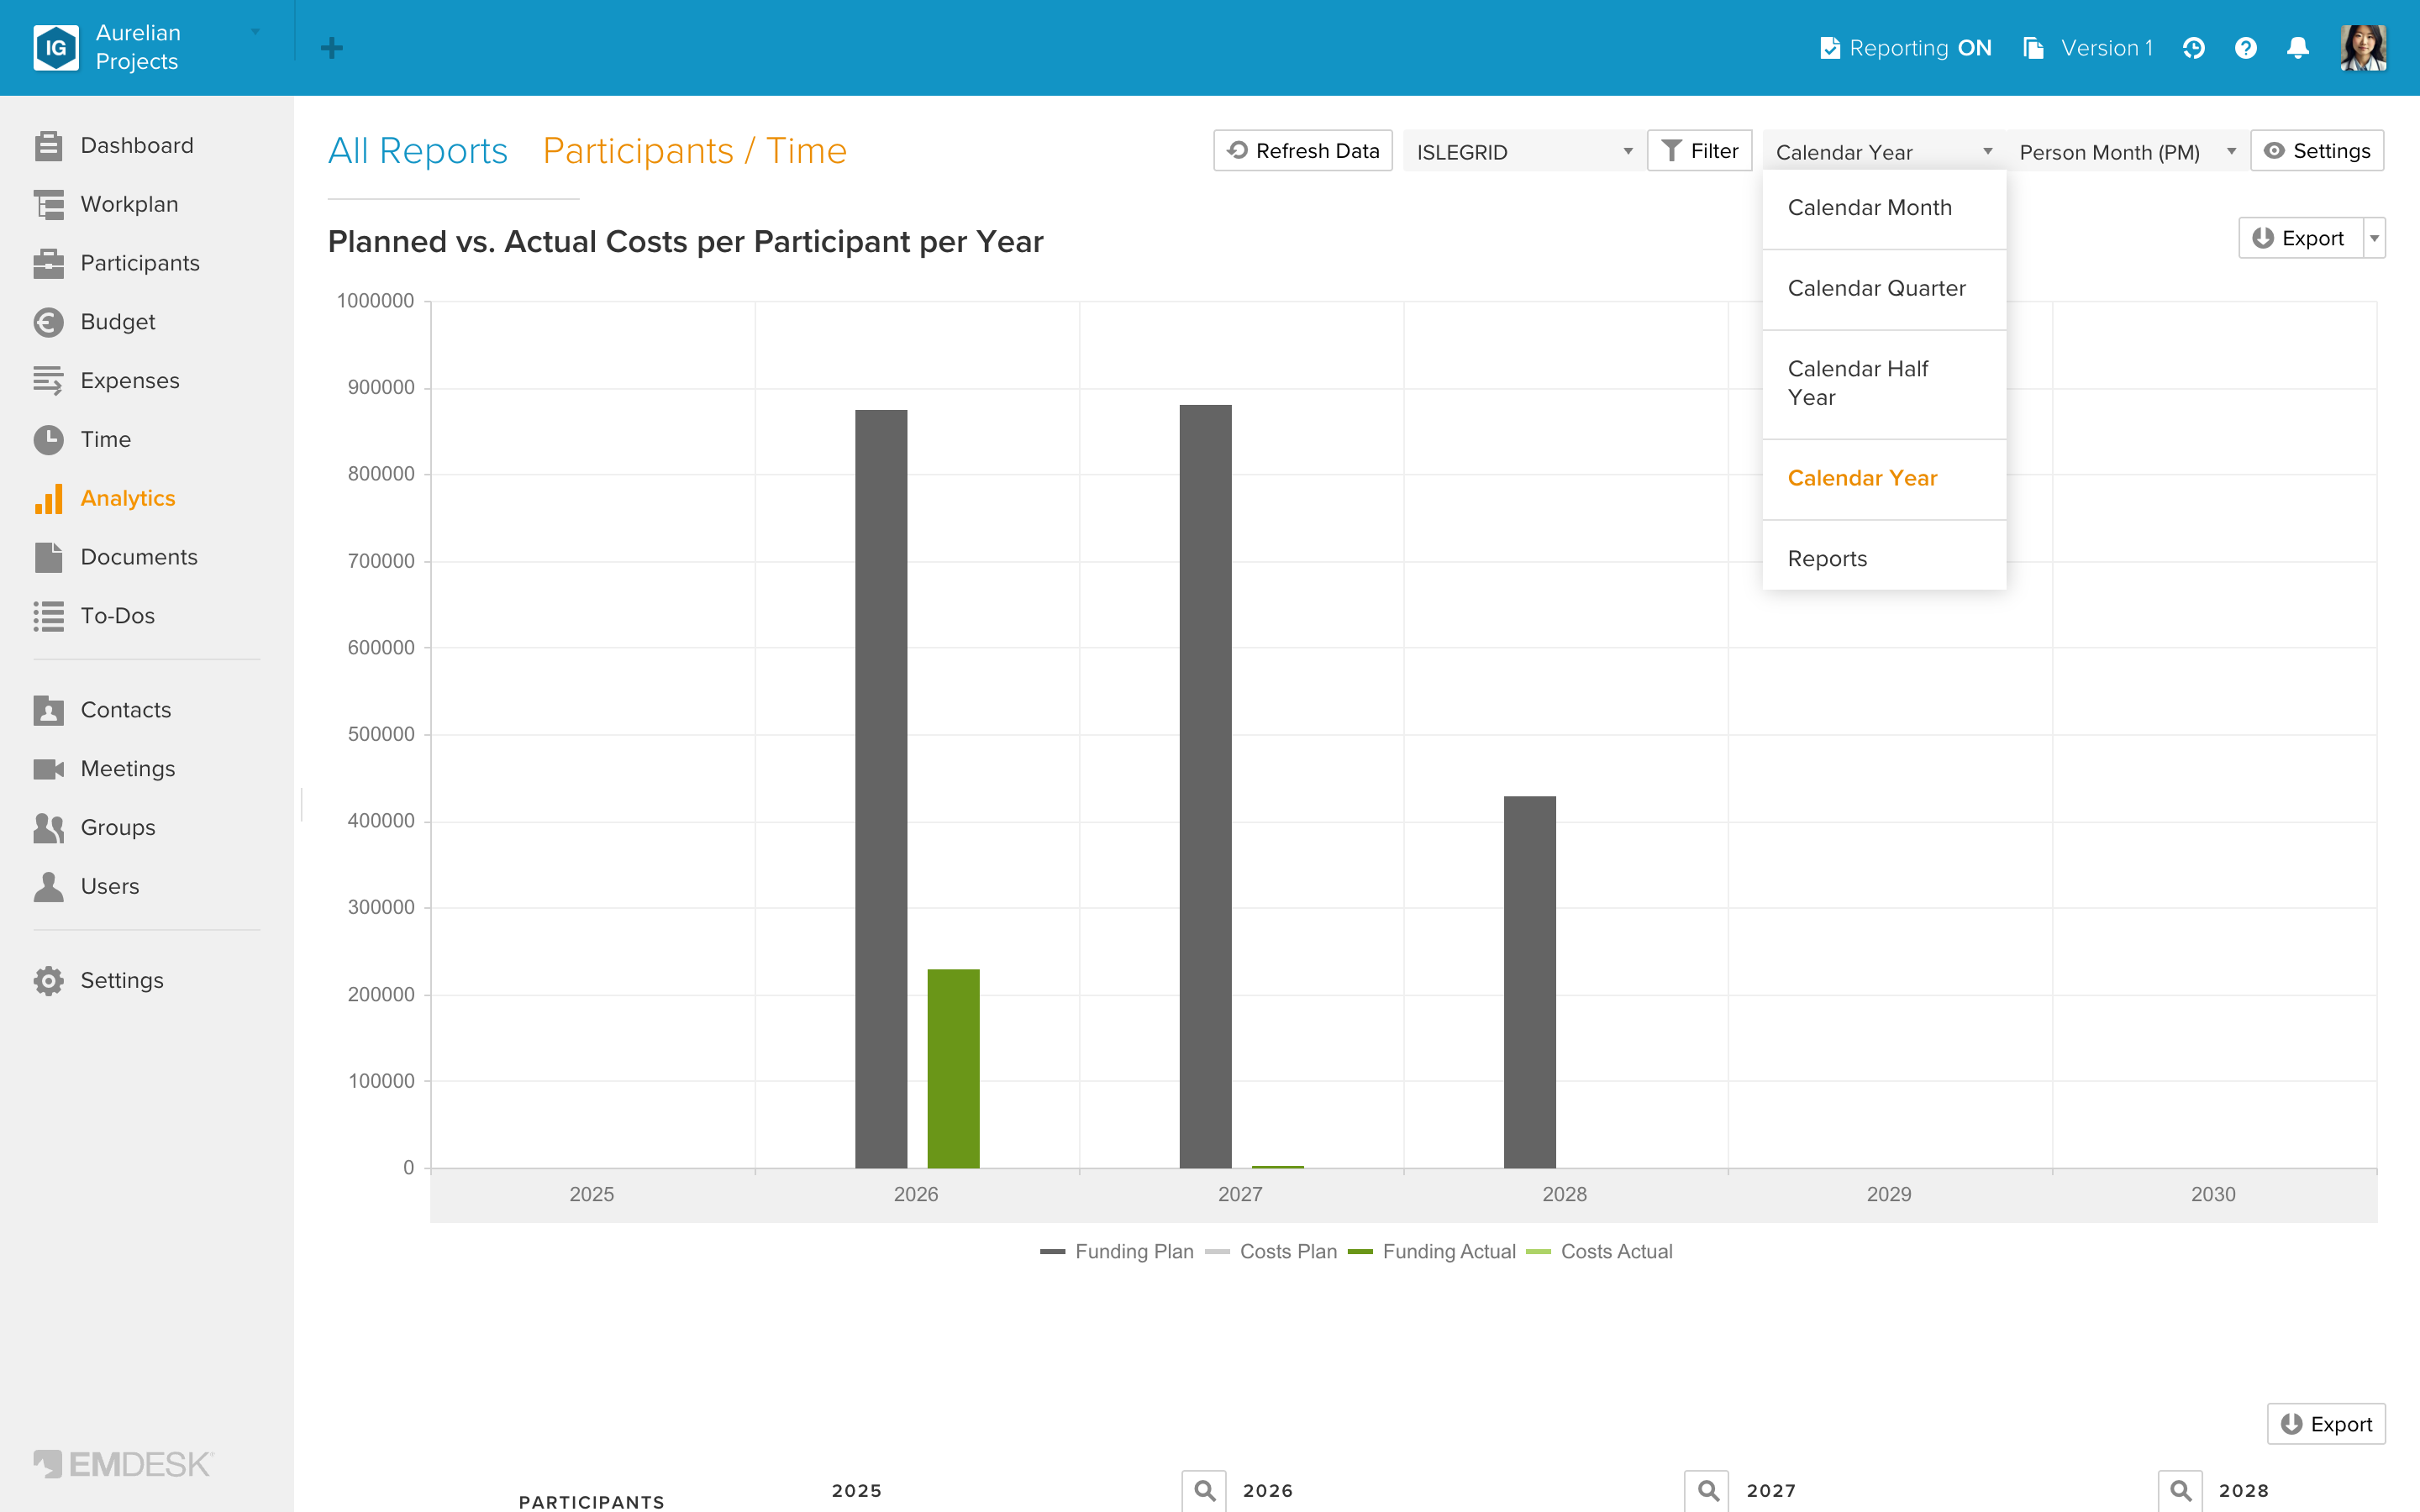
Pick the interval in the dropdown above the report. The default is Calendar Year.
- Calendar Month, Calendar Quarter, Calendar Half Year, Calendar Year follow the calendar.
- Project Month, Project Quarter, Project Half Year, Project Year count from the start of the project instead. They are offered in workspaces without projects, or once you chose a project in the project filter.
- Reports shows one column per reporting period. It is offered under the same conditions as the project intervals. If no reporting period exists, the report says so.
Zoom in and out
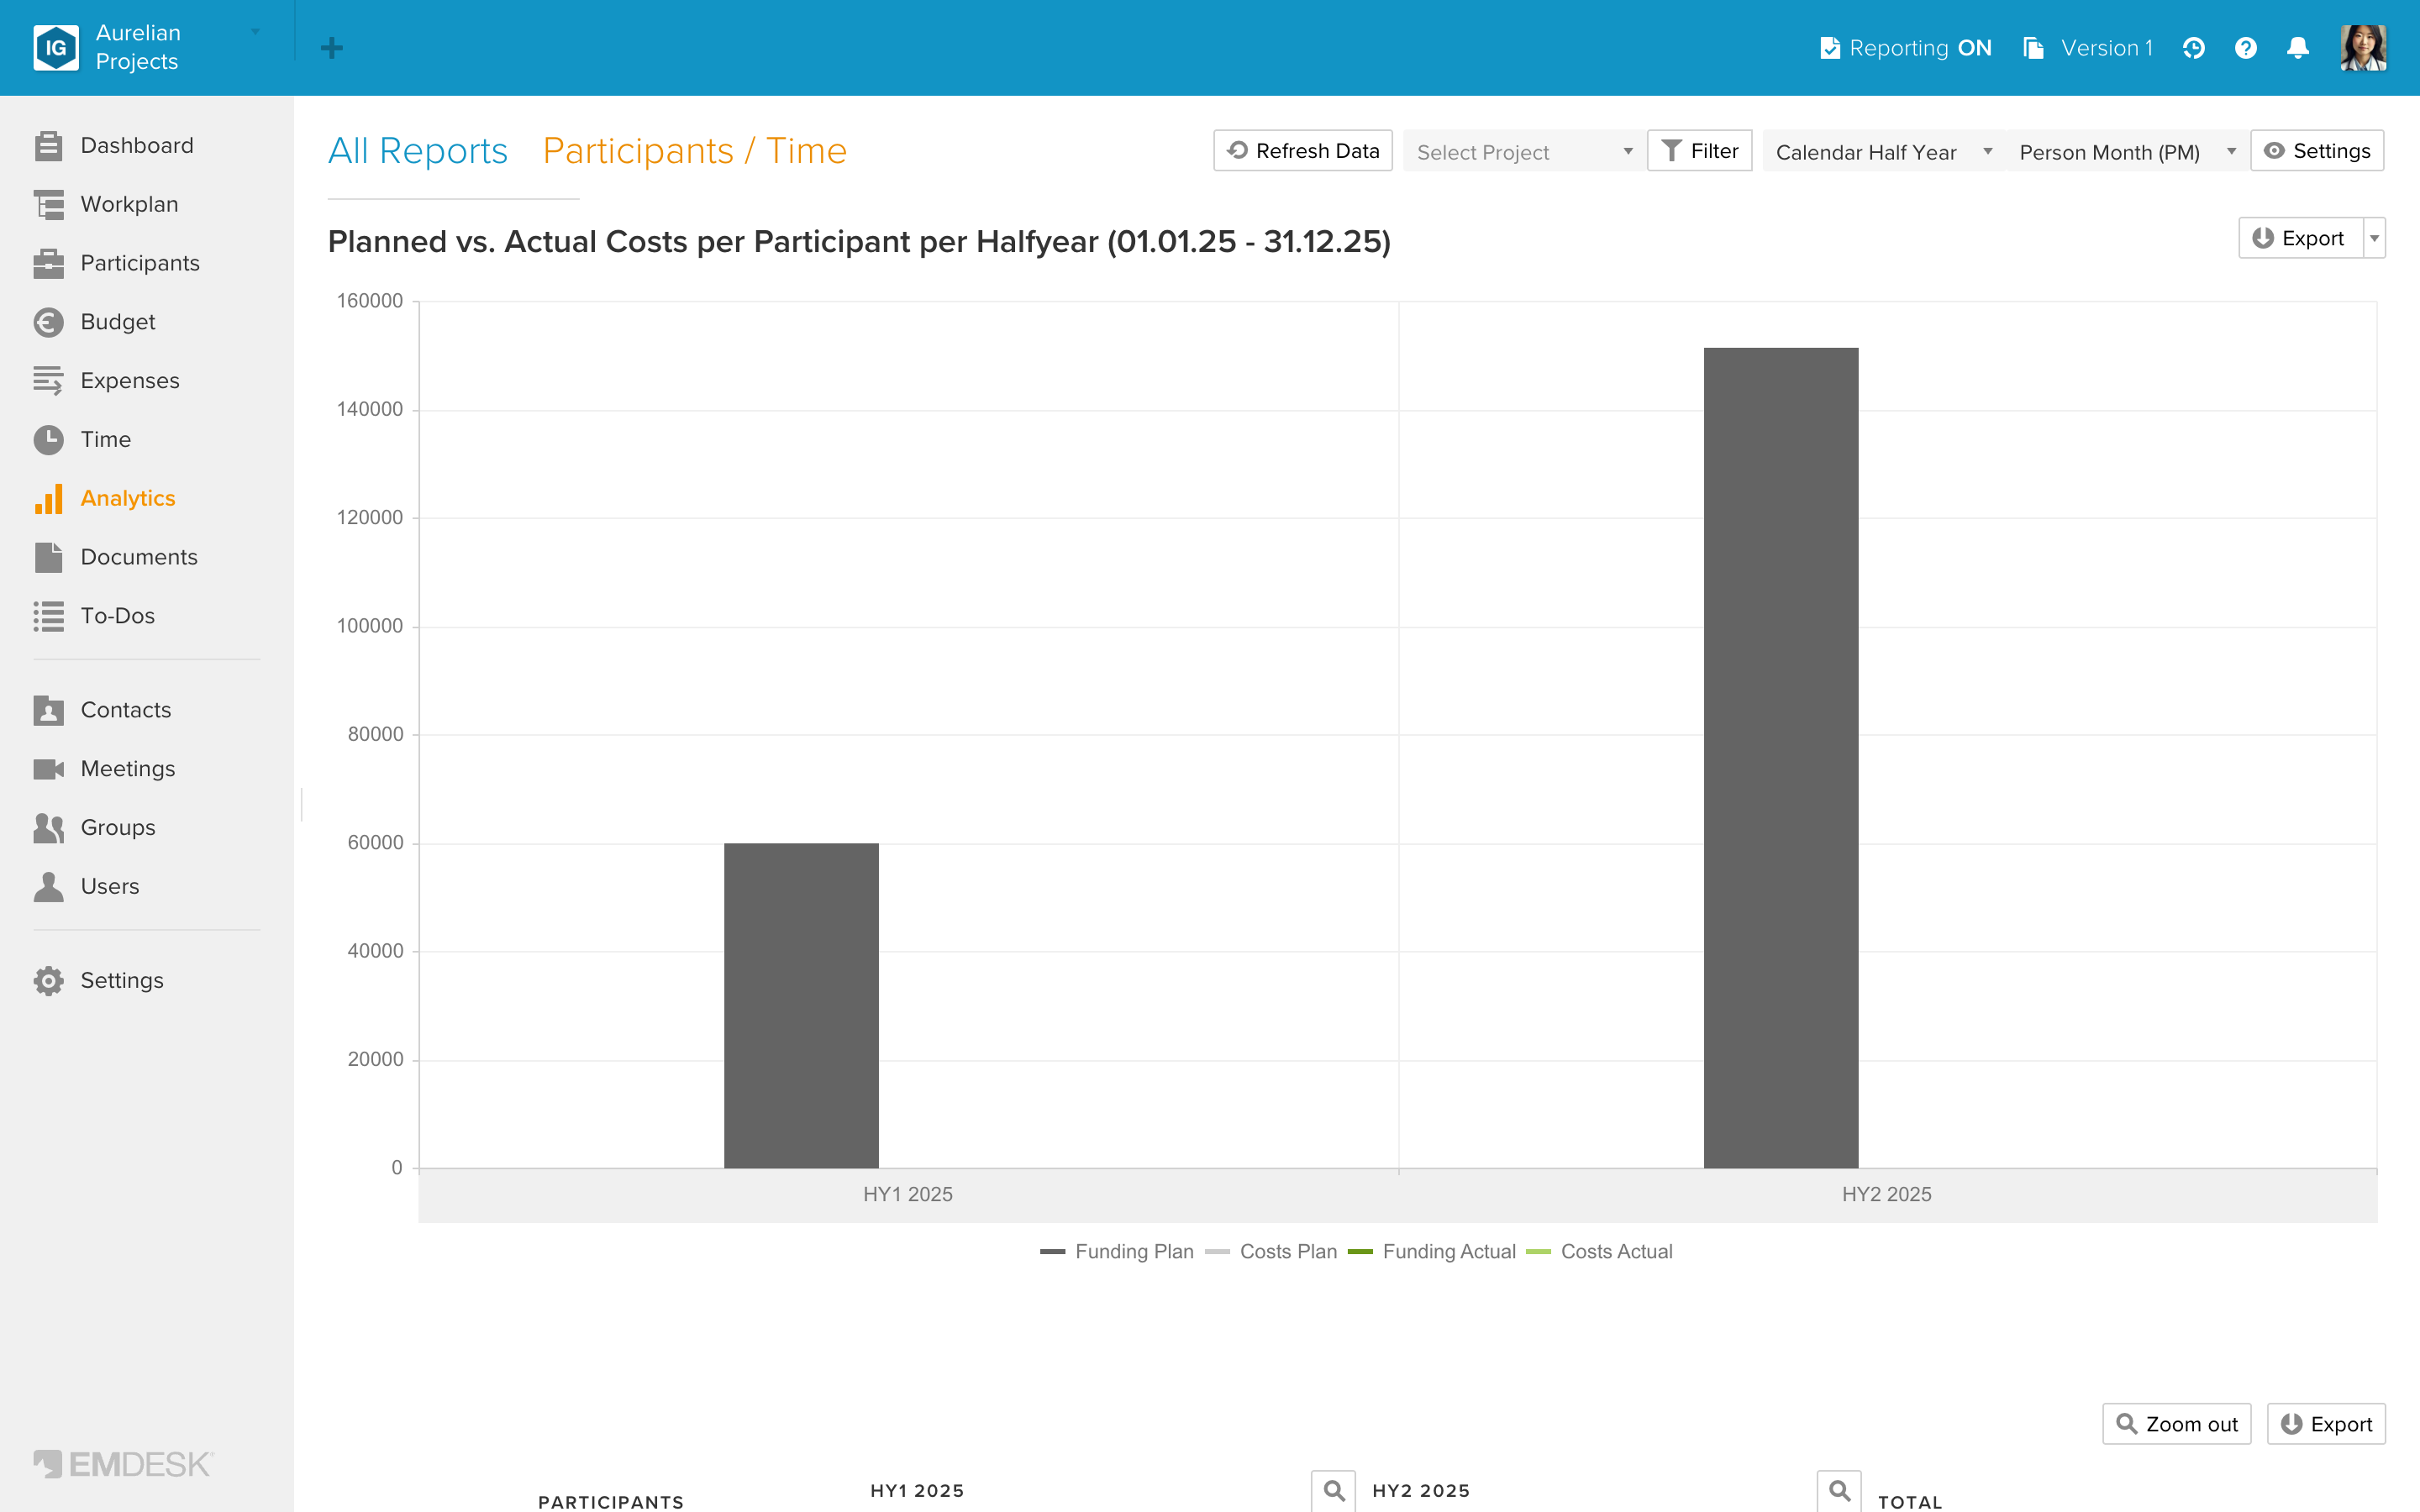
Each period column has a magnifier button in its header. Click it to look at that period one step finer: year to half year, half year to quarter, quarter to month. EMDESK sets Date From and Date To for you, and the headline shows the date range.
To go back, click Zoom out. The button sits at the lower right of the chart, next to Export, just above the table. The Reports interval has no zoom.
Because zooming uses the date filter, it works together with your other filters. See "Filter Analytics reports".
Running totals
Switch on Accumulated Horizontal in the Settings to see, in each period, the total up to and including that period. The Total column still shows the plain sum. See "Analytics view settings".
An entry that stretches over several periods is split between them. Budget items are planned in project months (month 1 starts at the project start date). An item runs from the start of its first project month to the end of its last one, and the part inside a period is counted by days. Expenses with a start and end date are split by days too. See "Why Analytics figures can differ from Budget and Expenses". The cells in the Time reports have no magnifier, so you cannot jump to Budget or Expenses from them.