
Time and Capacity Dashboard
The All Times tab in the Time section is the time and capacity overview of your team: for each user it shows the hours tracked per day, compared with their capacity, including leave and overtime. It lists all users whose time you may see (see About time tracking).
Click Time in the main menu and open All Times.
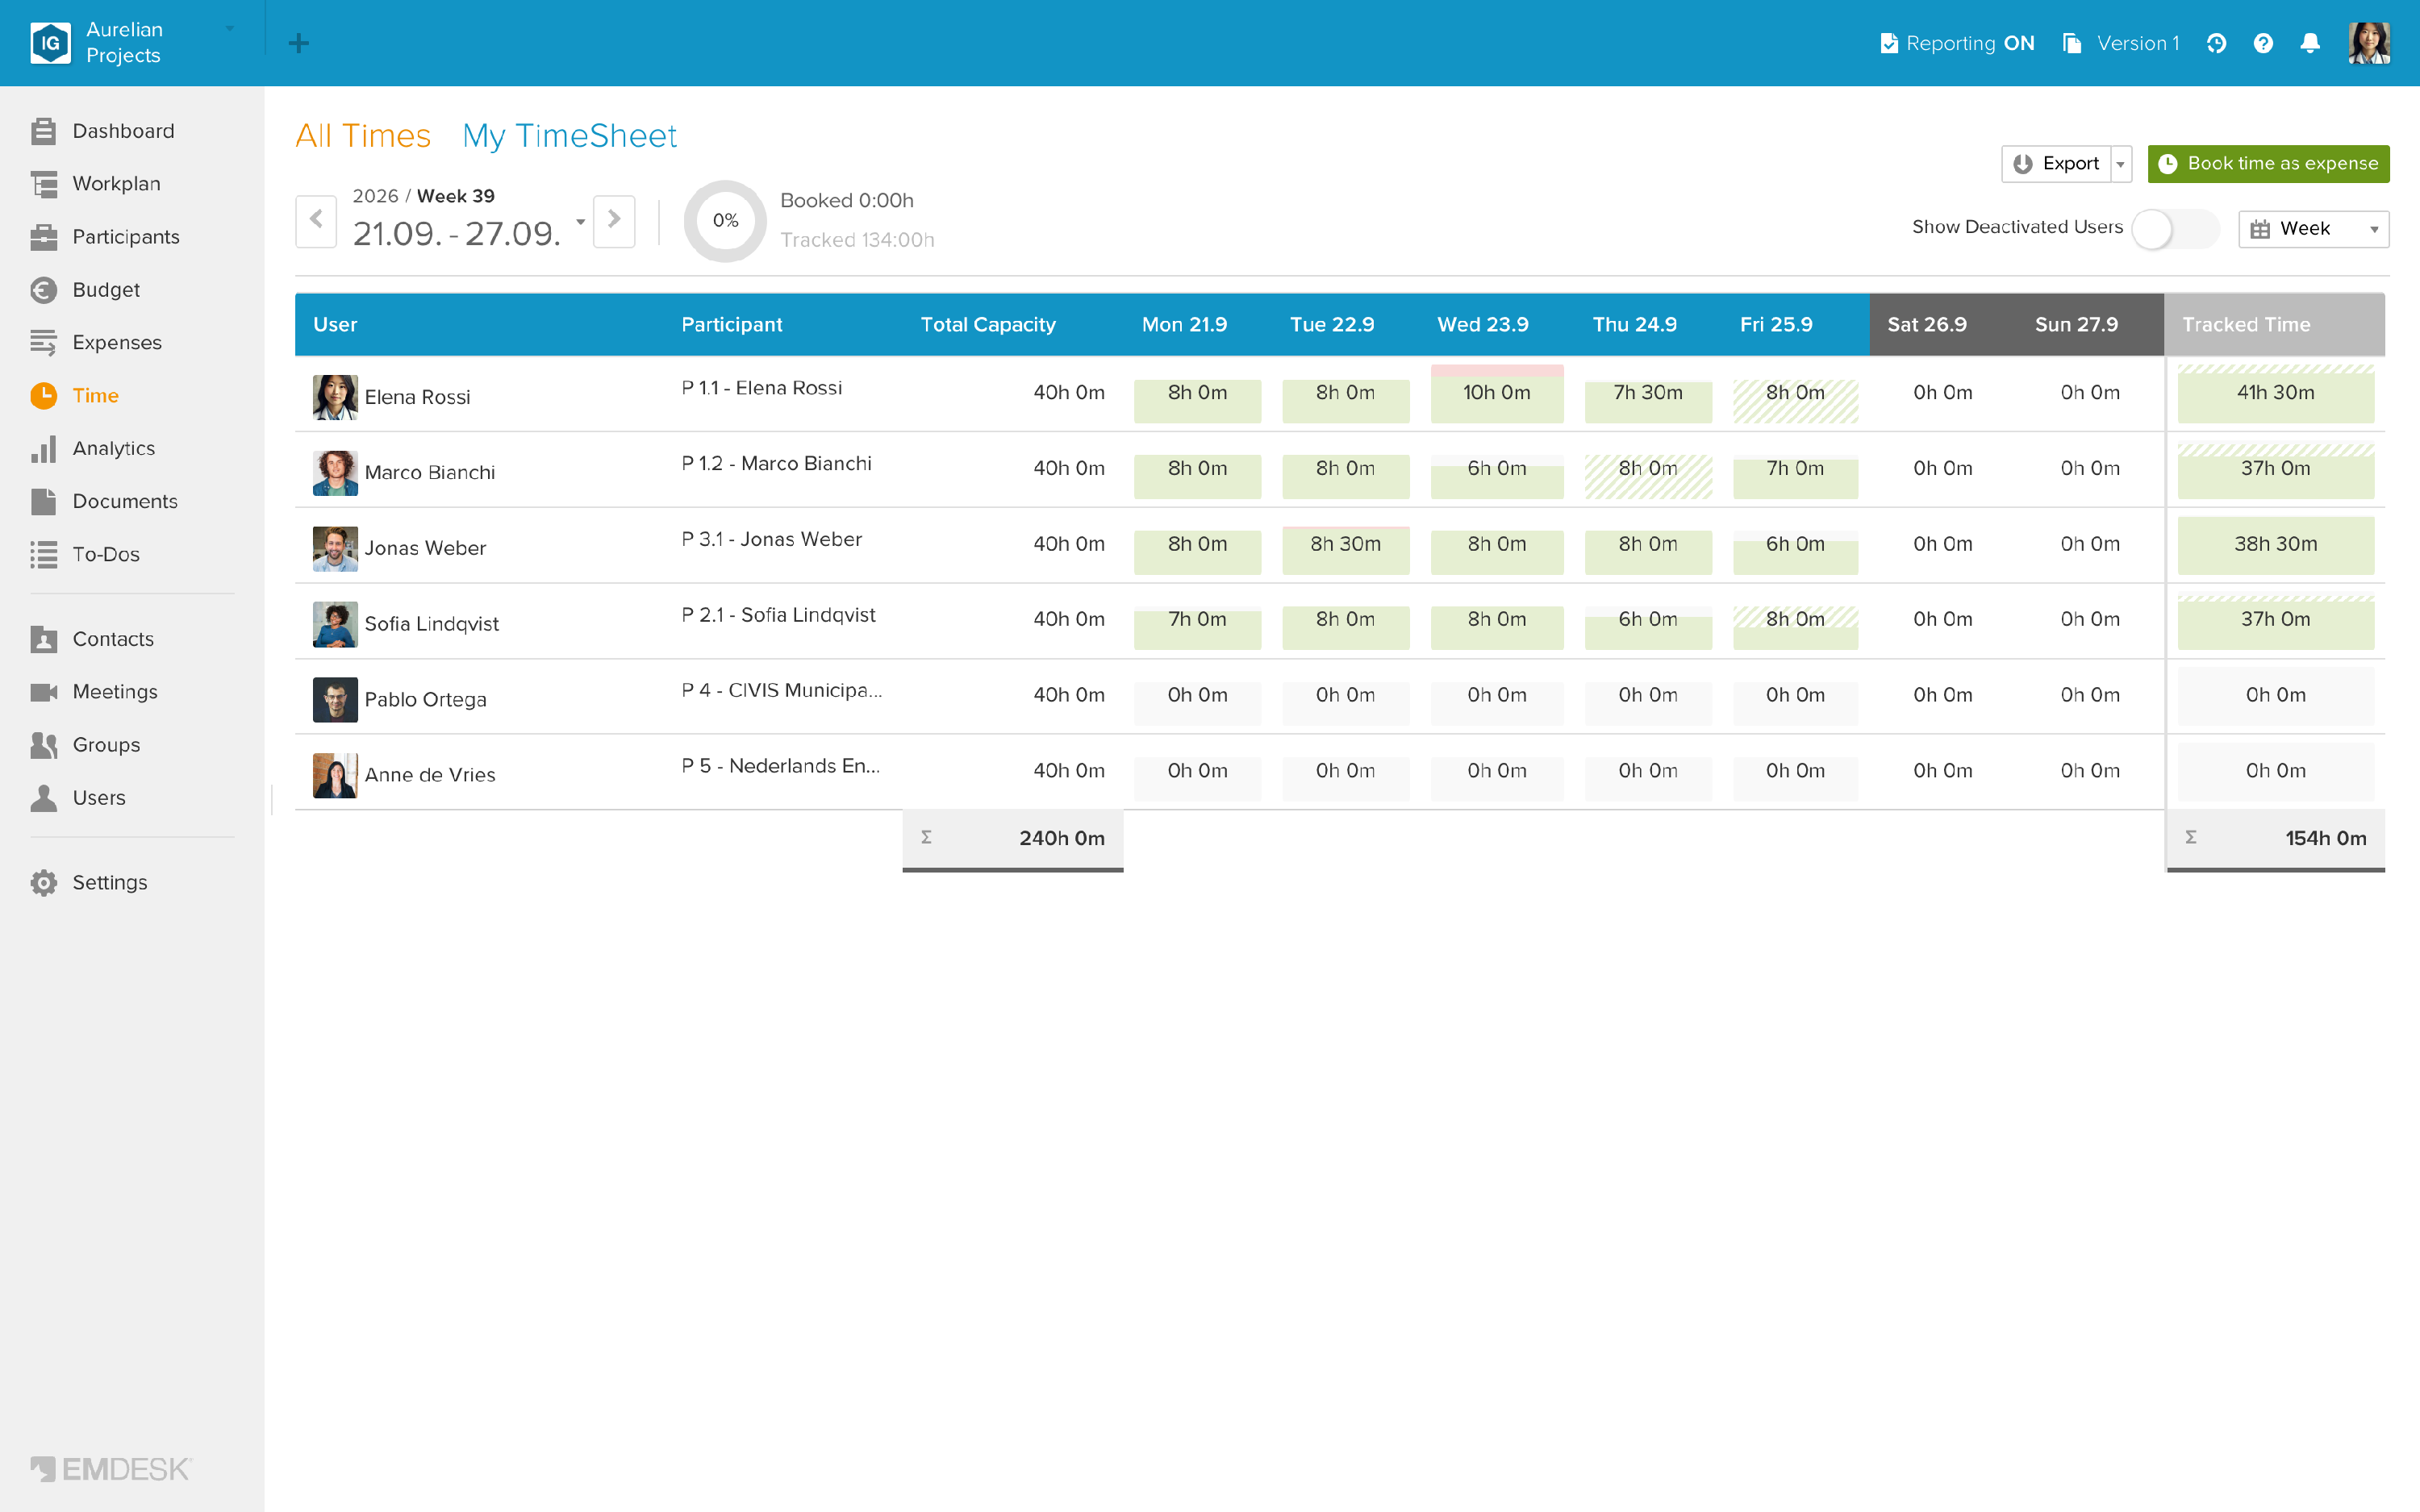
The table
- User and Participant: the user and the participant they are a member of.
- Total Capacity: the user's capacity for the period. Admins and Managers can hover over it and click the pencil icon to change it.
- One column per day (per month in the year view) with the hours tracked, and Tracked Time: the total of the period. The bottom row shows the sums.
Each cell has a bar:
- Grey: capacity
- Green: hours tracked
- Striped: leave
- Red: overtime (more hours than the capacity)
Details of a day
Hover over a cell to see how the day adds up:
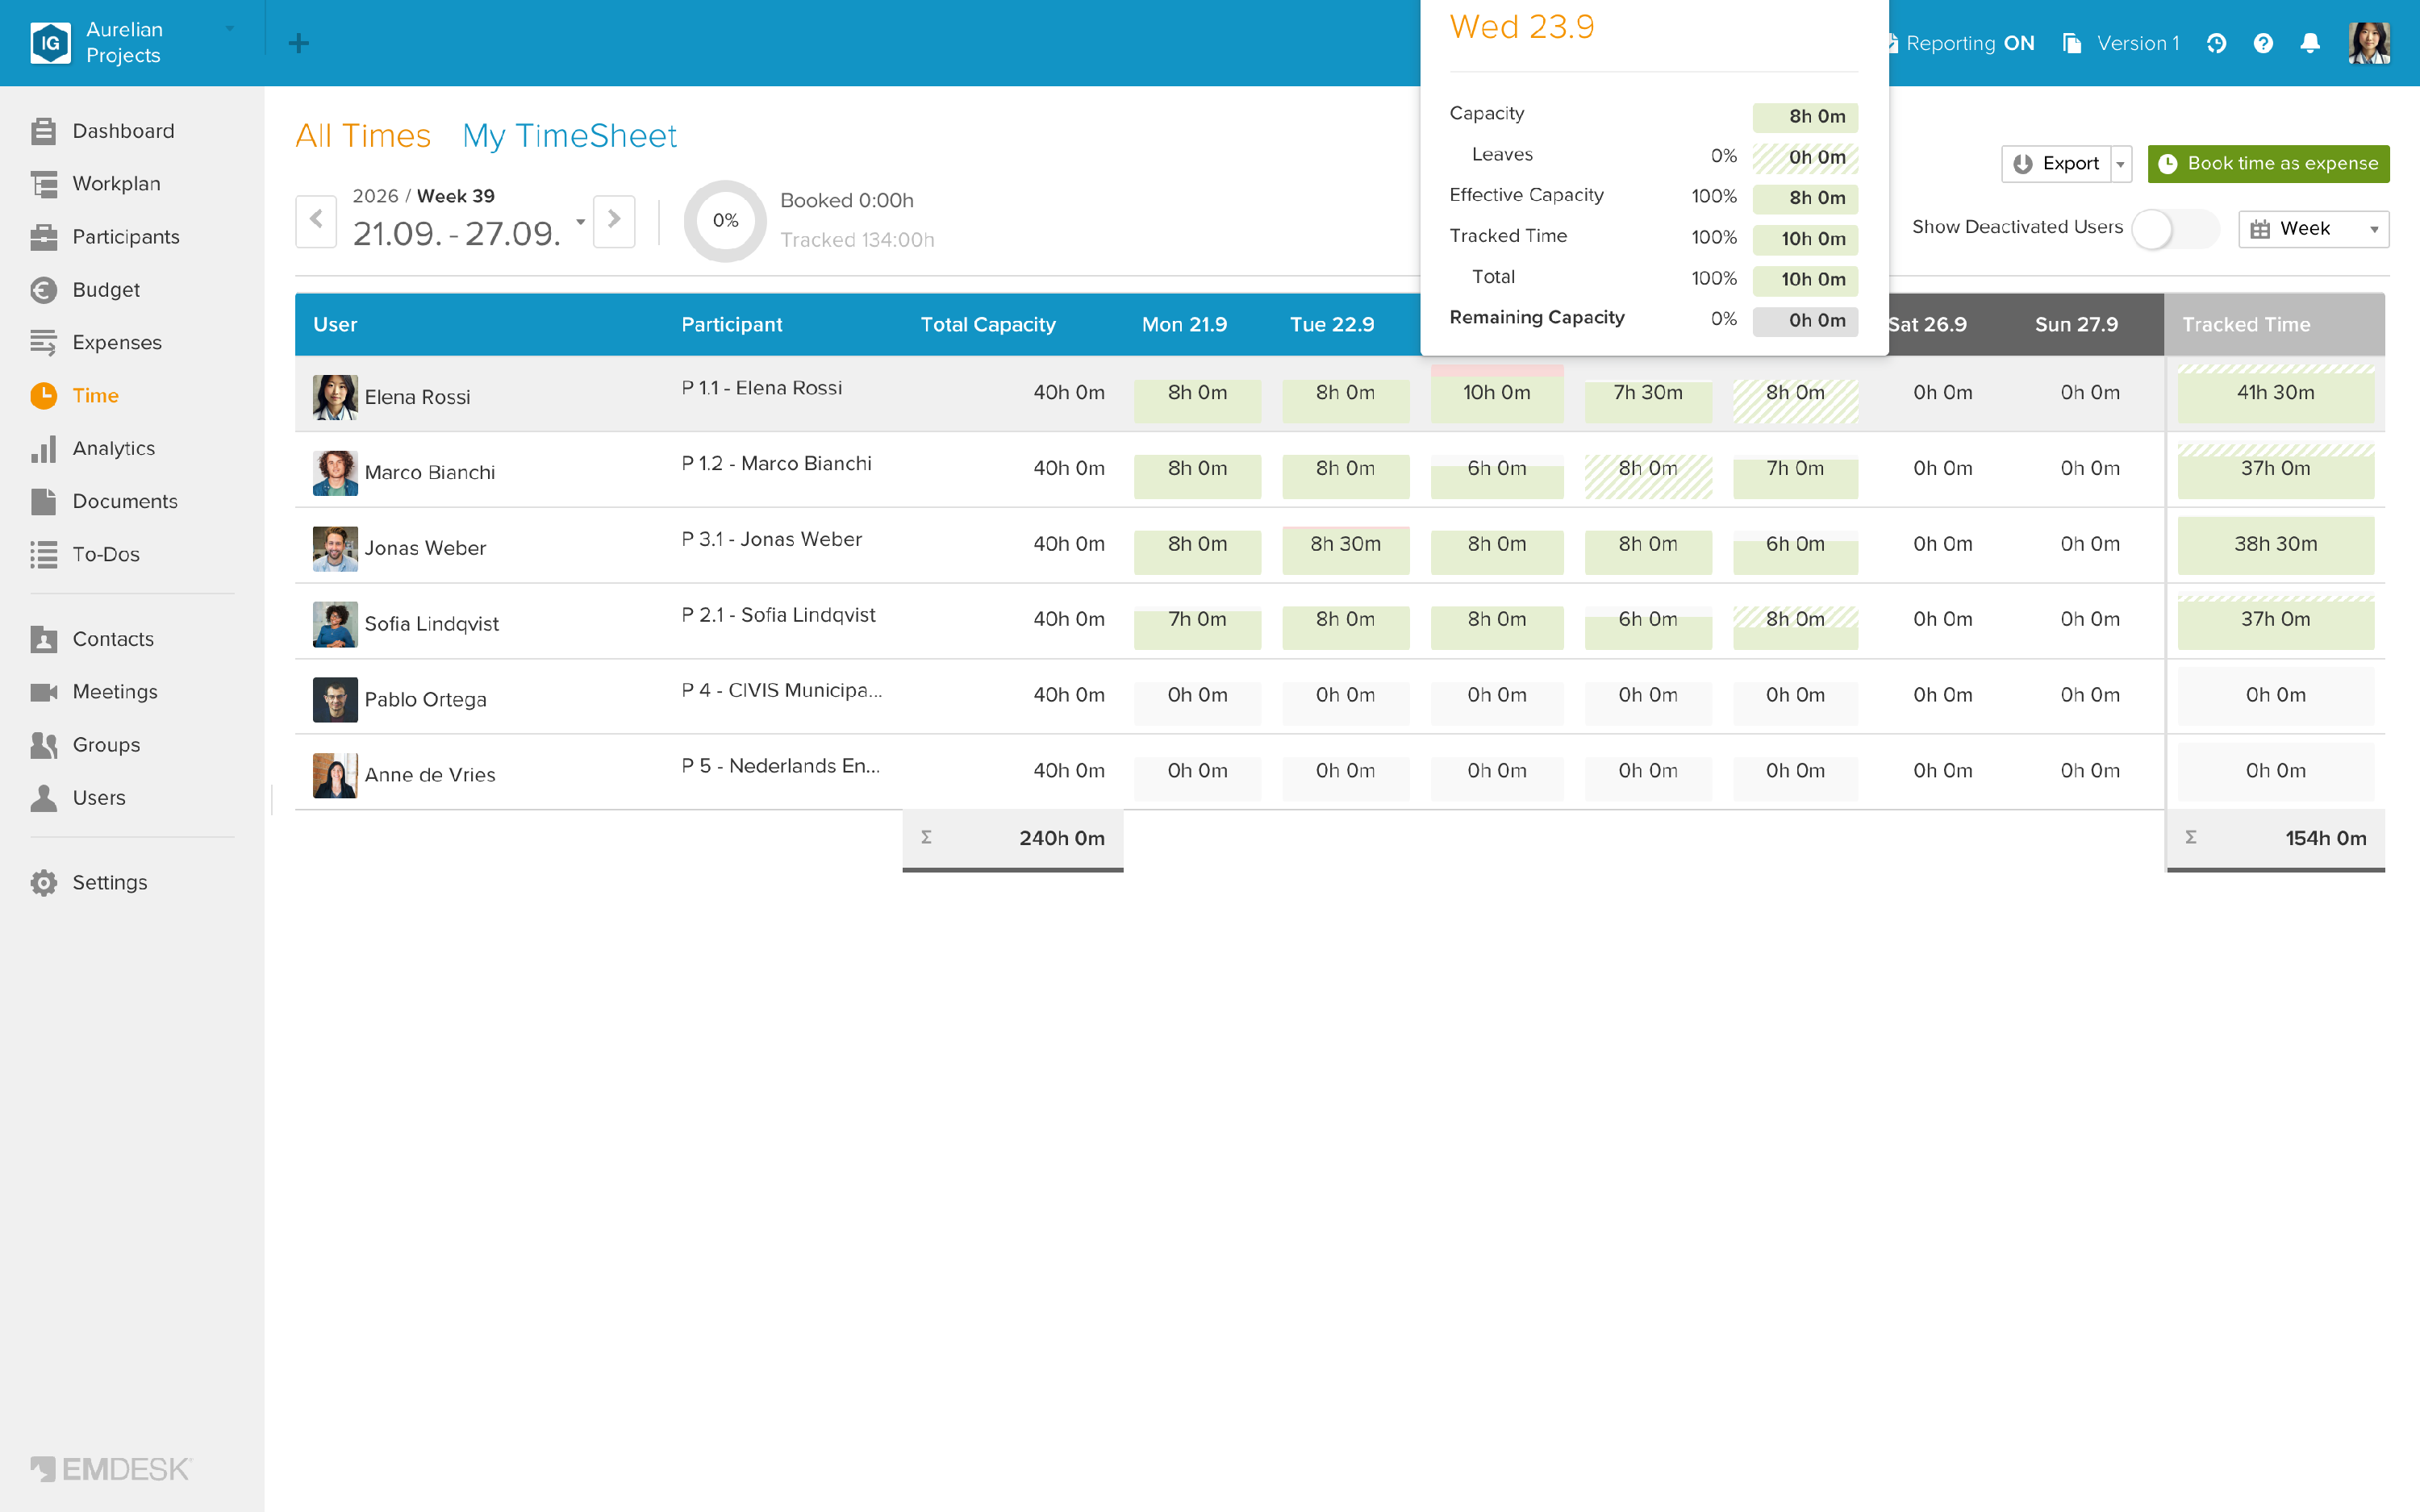
- Capacity: the hours the user is expected to work that day
- Leaves: hours of leave
- Effective Capacity: capacity minus leave
- Tracked Time: work time tracked
- Total: tracked time plus leave
- Remaining Capacity: hours still available
Working with the overview
- Use the arrows at the top left to move through the periods, and Week, Month or Year at the top right to change the range.
- Click a user or their Tracked Time to open that user's timesheet in My TimeSheet. Click a day to see that day's entries in the list view.
- Switch on Show Deactivated Users to include users who have been deactivated.
- Export downloads the overview as Excel or CSV, and Book time as expense books the time of the period (see Book timesheets as expenses).
The overview compares tracked time with capacity. Planned effort (person-months) and budgets are shown in the Workplan, Budget and Analytics.