Working with the Gantt view
The Gantt view
The Gantt view is a graphical time-plan that displays the timing of projects, activities, deliverables, and milestones alongside their dependencies. It shows the projects Work Breakdown Structure (WBS), the total timeline, timing, and dependencies between projects, activities, deliverables and milestones and their status (progress, consumption, and/or deviation).
To access the Gantt view, go to Workplan and then click Gantt.
- Gantt chart essentials
- Filter by project
- Browse WBS and fold/unfold branches
- Customise columns
- Export Gantt chart
- Change time scale
Essentials

- The left column shows the projects with a collapsible view of all activities, deliverables and milestones, and their details, e.g. ID, title.
- The right column shows the timeline as a graphical display of the project and work plan.
- The two sides are separated by a sliding bar that can be dragged left or right to increase the view of either side.
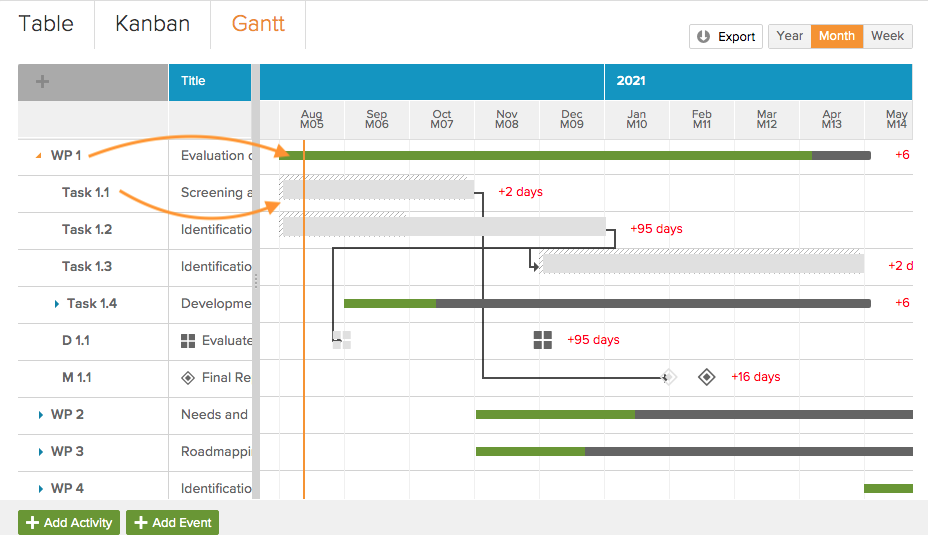
- "Today" is marked by a vertical orange line in the timeline.
- Hover over any bar, deliverable, milestone, or report icon to get a popup card with further details.
- Clicking on any bar or icon will open the sidebar for that item.
- Similar to the Table and Kanban views, you can click Add Activity or Add Deliverable/Add Milestone at the page bottom to add new items.
Filter by project
Use the project dropdown in the header to filter the Gantt view by specific projects within your workspace. This helps you focus on particular projects without the distraction of other work.
- 1
- Click the project dropdown in the Gantt header
- 2
- Select the project you want to view
- 3
- The Gantt chart will update to show only items from the selected project
Browse WBS and fold/unfold branches
The Gantt view displays the projects as a full hierarchical list of projects with sub-activities, which can be expanded to display sub-level activities, deliverables, and milestones.
Projects and work packages with sub-activities (packages) will have a small arrow to their left. Click this arrow to unfold the branch and show the sub-activities, deliverables, or milestones. The corresponding graphical data shown in bars on the right will also expand and collapse accordingly.
Projects and work packages with sub-activities
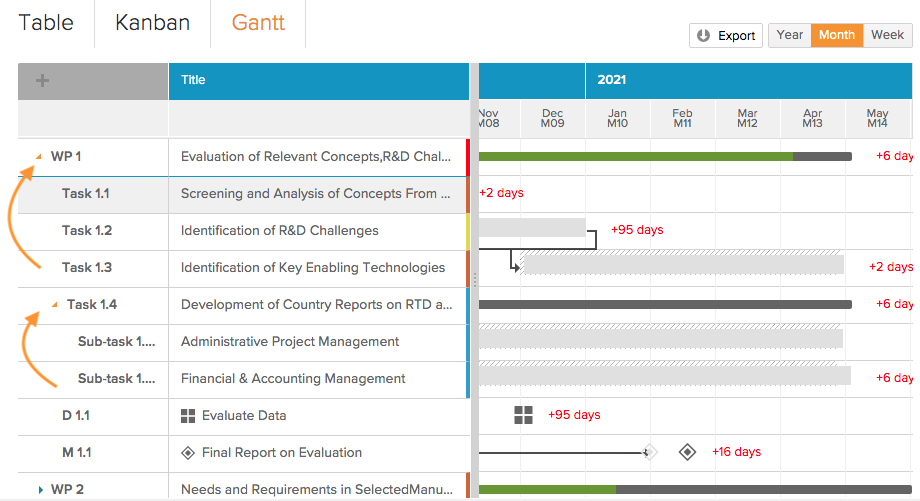
- The solid thin grey bars represent projects and activities containing further sub-activities (packages), e.g. Work Package - Task.
- The bars show the actual timing of the activity and are filled with green to show the level of completion (e.g. no green = 0%, full green = 100%).
Projects and Activities with no sub-activities
- Thick bars represent activities at the lowest level (tasks).
- Striped bars in the background display the planned timing.
- Solid bars in the foreground show the actual timing according to the latest status update of the activity.
- On-time activities are displayed in light green and the progress in percentage according to the latest status in dark green (full green bar = 100%).
- Overdue activities are displayed in light red and fill in deep red according to their progress.
- Due activities are displayed in light yellow and fill in deep yellow according to their progress.
Deliverables and Milestones
- Displayed as light grey icons for their planned achievement date and dark grey icons for their actual achievement dates.
- Deliverables are represented by packages (four squares)
- Milestones are represented by diamonds
Tip: Clicking on an activity or deliverable/milestone row or bar/icon in the timeline opens it in the sidebar.
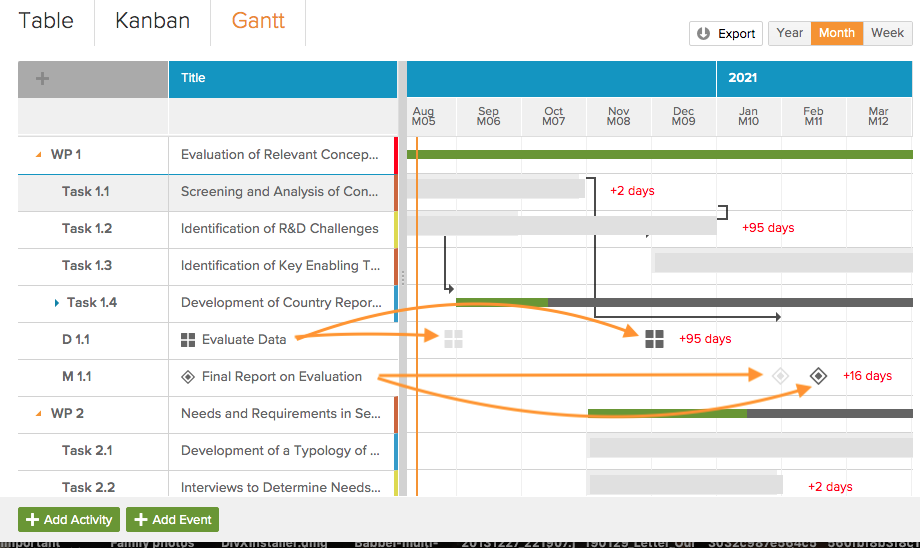
Dependencies
- Arrows between activities show the dependencies between them.
- The arrows begin at the defined predecessors and point to the successors.
Tip: Click a successor to open the sidebar, switch to the 'Edit' tab and set the successor.

Deviations
Numbers to the right of activities, deliverables, and milestones show deviations from the plan in days.
- Earlier deviations are shown as a negative number of days in green.
- Later deviations are shown as a positive number in red.
Note: The deviation is defined by the plan end or achievement month (last day of the month) minus the forecast end or achievement date.
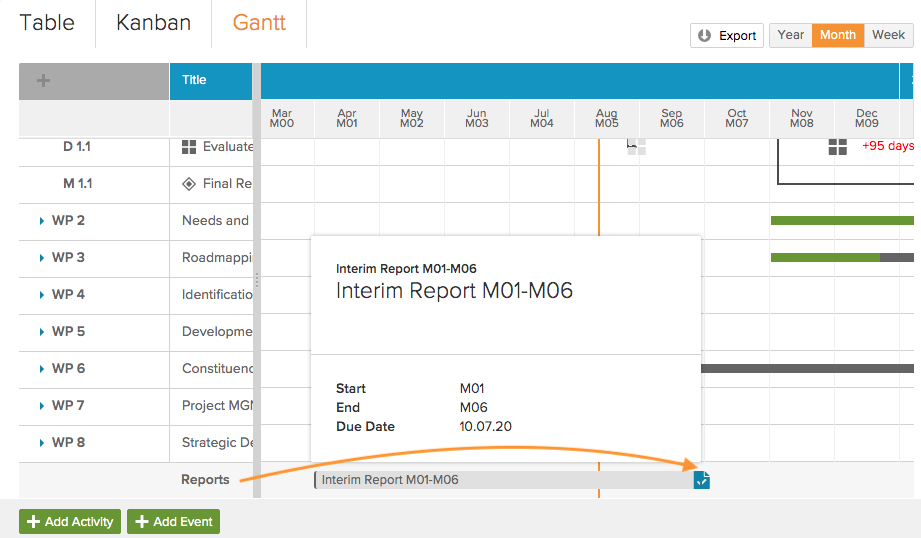
Reports
- Document icons containing a check, towards the bottom of the timeline indicate scheduled reports by their due date.
- Hover over the icon to display a bar showing the report's reporting period.
- Hover over the icon to display a quick view card with the report's details.
Tip: To update a report's details, reporting period, or due date, click on the report icon to open the sidebar.
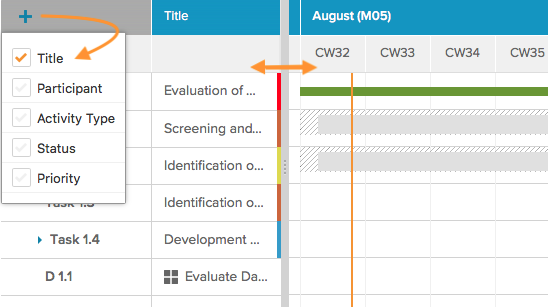
Customise columns
- 1
- Click on the + icon at the top left
- 2
- Check the options to hide or unhide relevant columns such as Title, Participant, Activity Type, Status, and Priority
Export Gantt chart
Export the current view of the Gantt chart as a PDF file for sharing or documentation purposes.
- 1
- Click the Export button at the top right
- 2
- The Gantt chart will be exported as a PDF with the current view settings
Change time scale
Switch between different time scales in the top right to adjust your view of the timeline:
- Year - Calendar years, by year, with a sub-display in quarters
- Quarter - Quarterly view for broader timeline perspective
- Month - Calendar months with a sub-display of correlating project month numbers
- Week - Calendar months and corresponding project month number with a sub-display of calendar weeks
