
Create and Manage Reporting Periods
A reporting period (called a report in EMDESK) is a time span of a project for which you report to your funder, for example Periodic report 1, M01–M18, with a due date. Once you have set up your reporting periods, EMDESK uses them throughout the workspace: to assign and filter expenses, to analyse data per period, and to show periods and due dates in the Gantt chart and on the dashboard.
Contents
Creating or editing a reporting periodWhere reporting periods are usedDeleting a reporting period
Creating or editing a reporting period
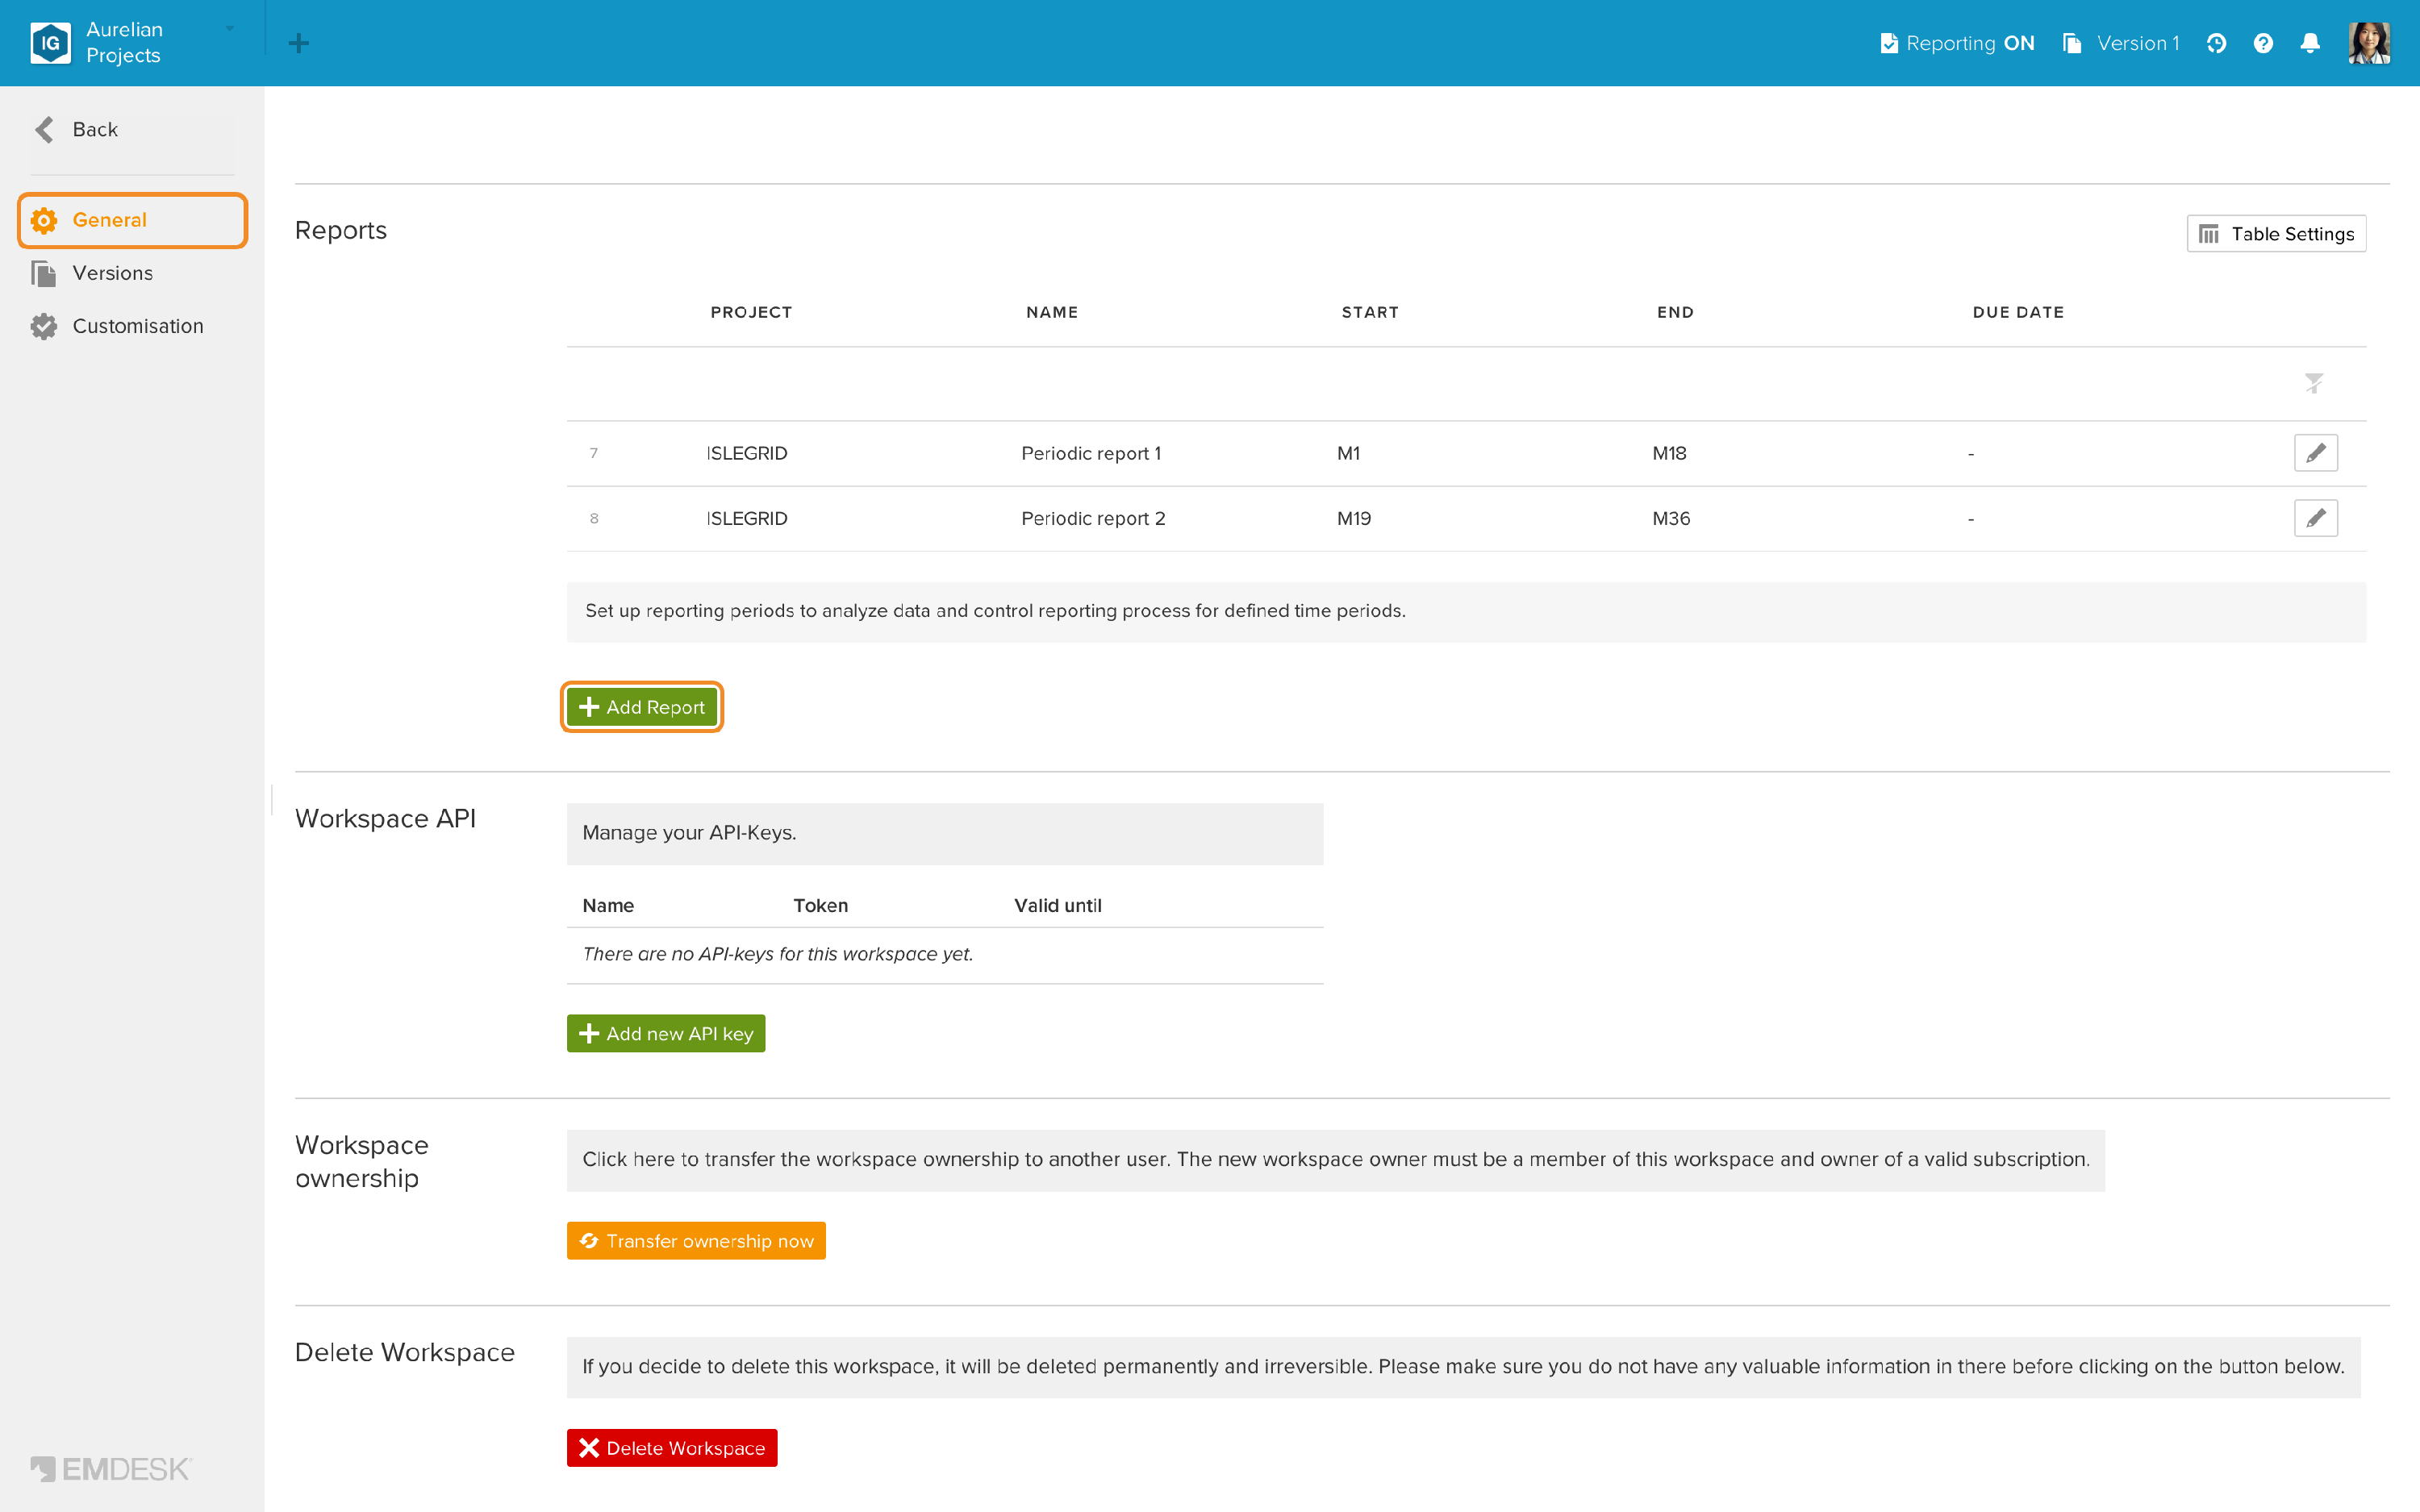
- Click Settings in the main menu. General opens; scroll to Reports. The list shows the project, name, start and end month and the due date of each reporting period.
- Click + Add Report to create a reporting period, or click the Edit (pencil) icon of an existing one.
- In the sidebar, set the properties of the reporting period:
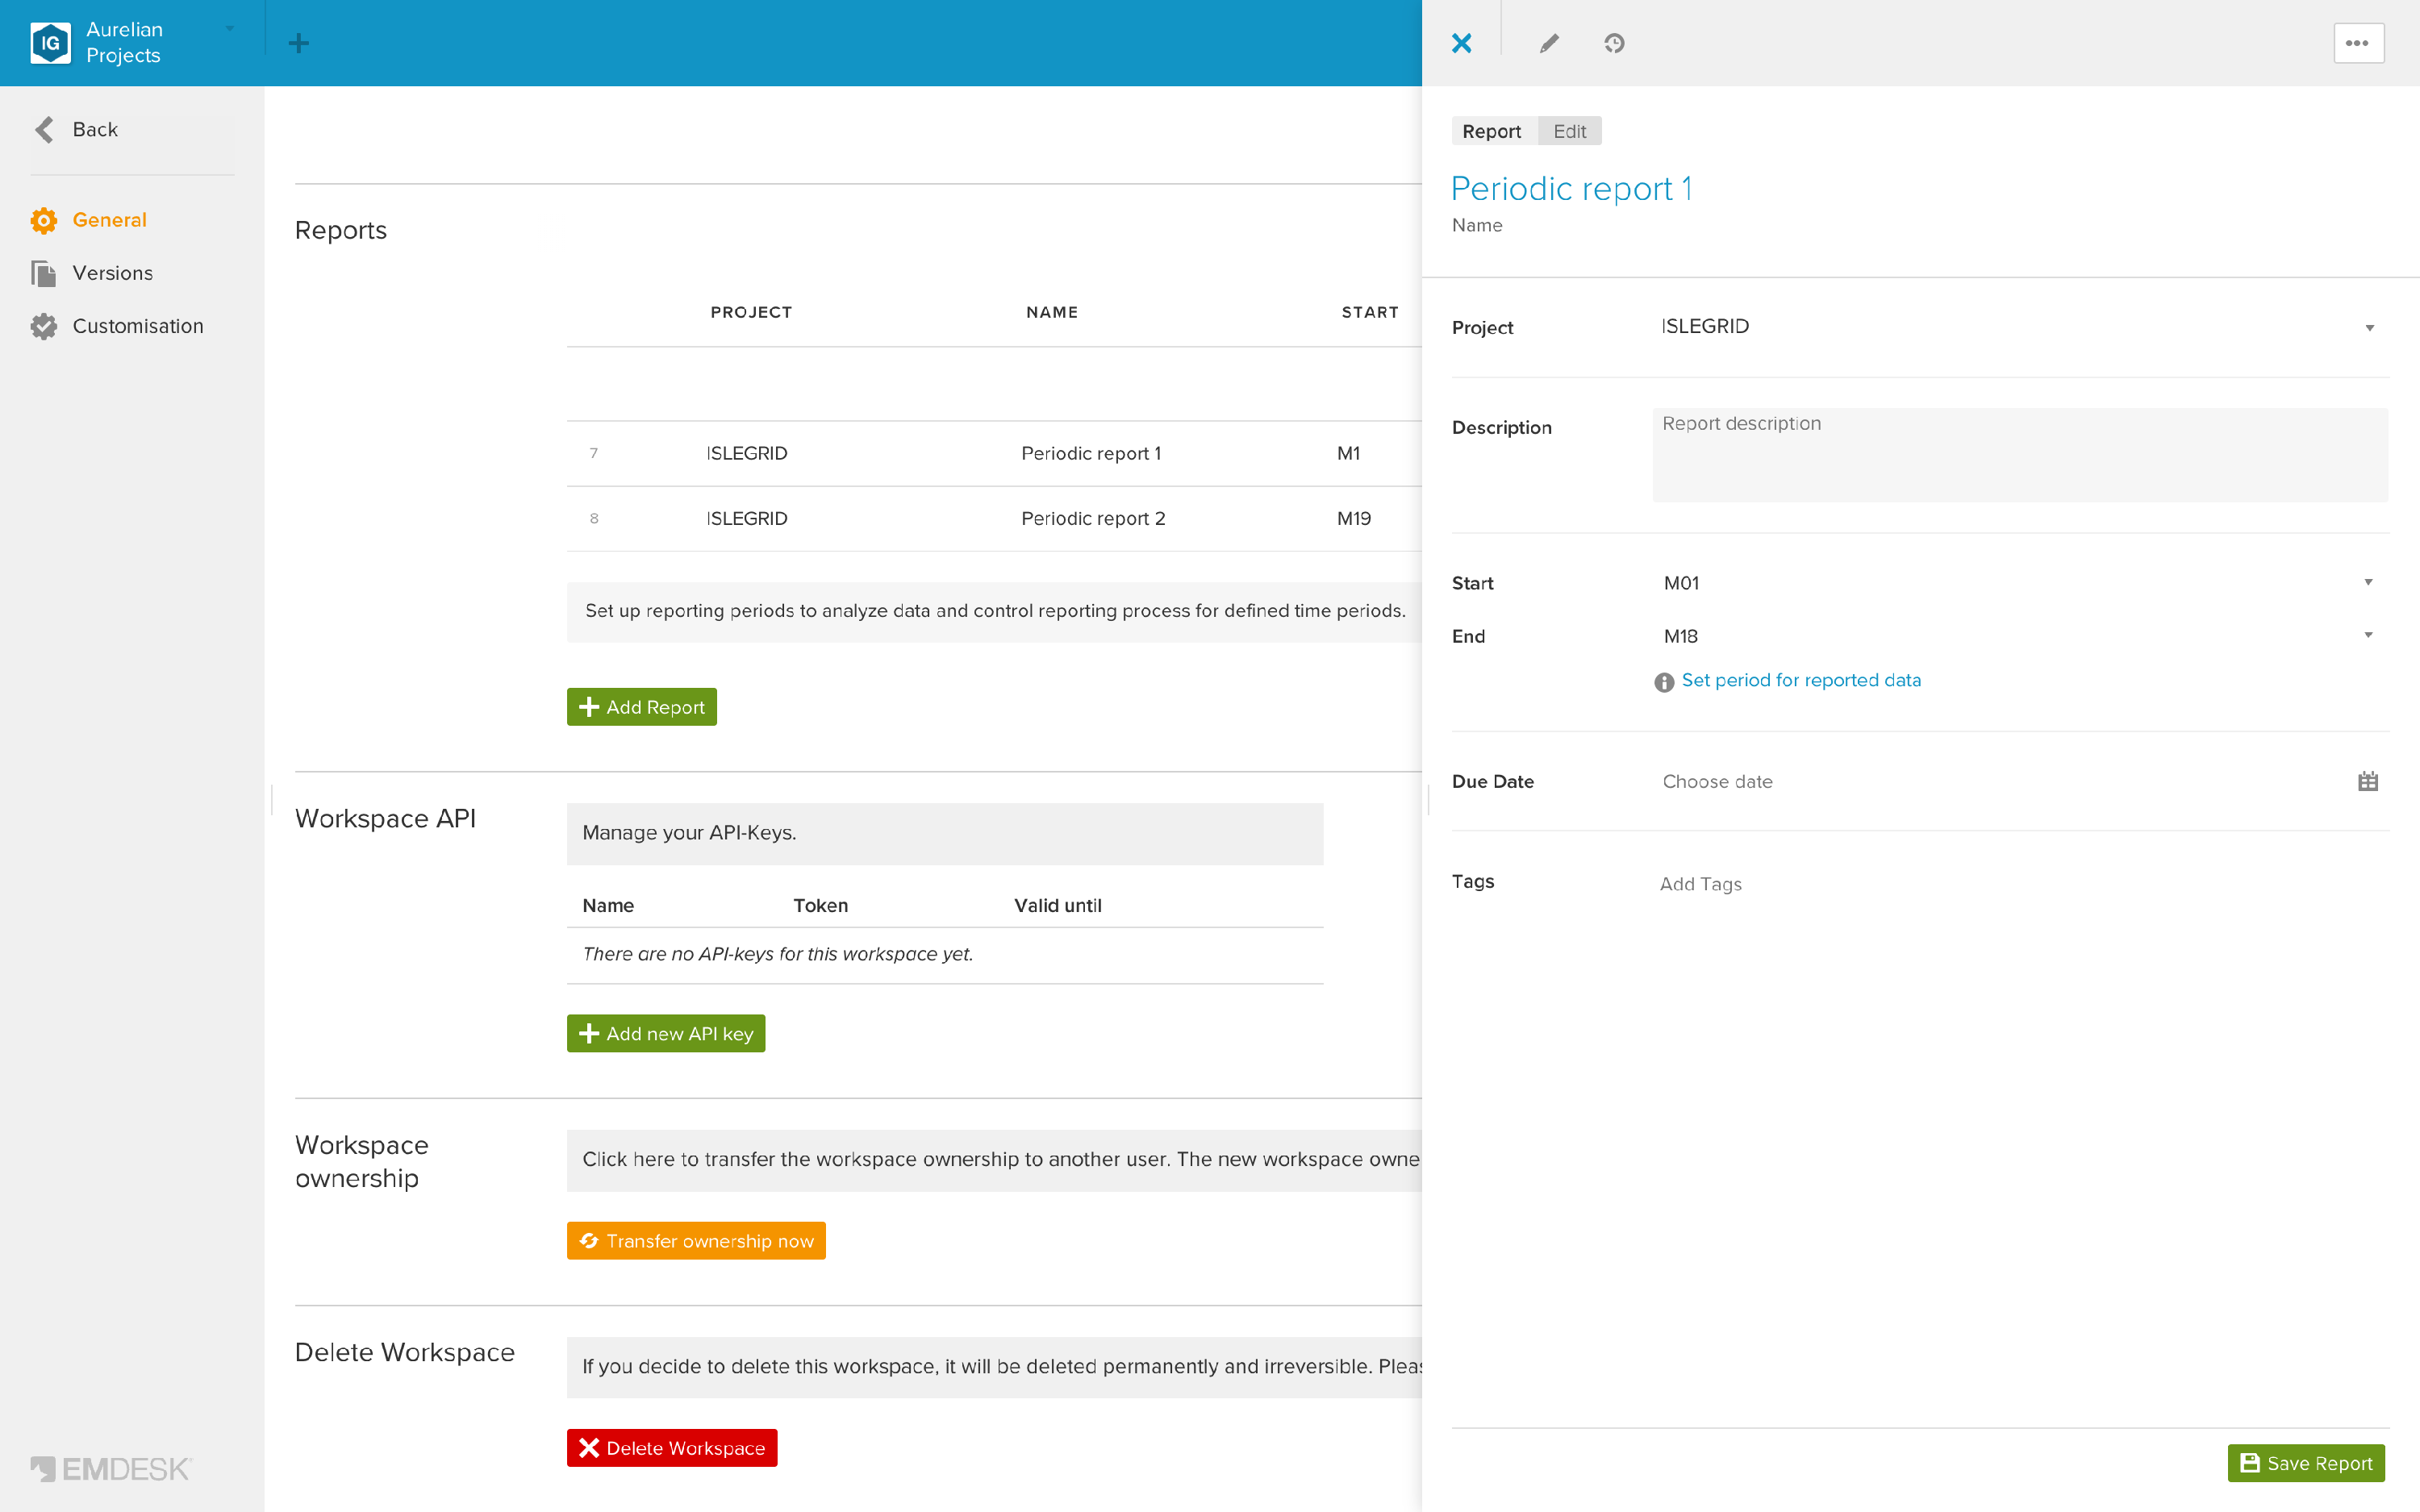
- Name: for example Periodic report 1.
- Project: the project the period belongs to (shown and required when your workspace has several projects).
- Description (optional).
- Start and End: the first and last project month of the period (for example M01 and M18).
- Set period for reported data (optional): click this link to set an Actual Start Date and Actual End Date if the data that belongs to this report differs from the months above, for example costs that are invoiced after the period has ended. Click Do not set period for reported data to remove it again.
- Due Date: the date the report has to be submitted.
- Tags (optional).
- Click Save Report.
💡 Note: If you change a reporting period that already has expenses assigned to it, EMDESK asks for confirmation and moves those expenses to the new period. If some of them are locked (or dated before a reporting lock), unlock them first (see Lock / unlock workspace items and Disable reporting temporarily).
Where reporting periods are used
- Expenses: when you report an expense you can assign it to a report instead of a date or time period. In the Expenses list, you can filter by report, show the Reports column, and change the report of several expenses at once with bulk edit.
- Analytics: filter by report instead of by date, and use reports as the time scale of charts.
- Dashboard: What's next and Overdue list reports that are due.
- Gantt chart: see below.
Reporting periods in the Gantt chart
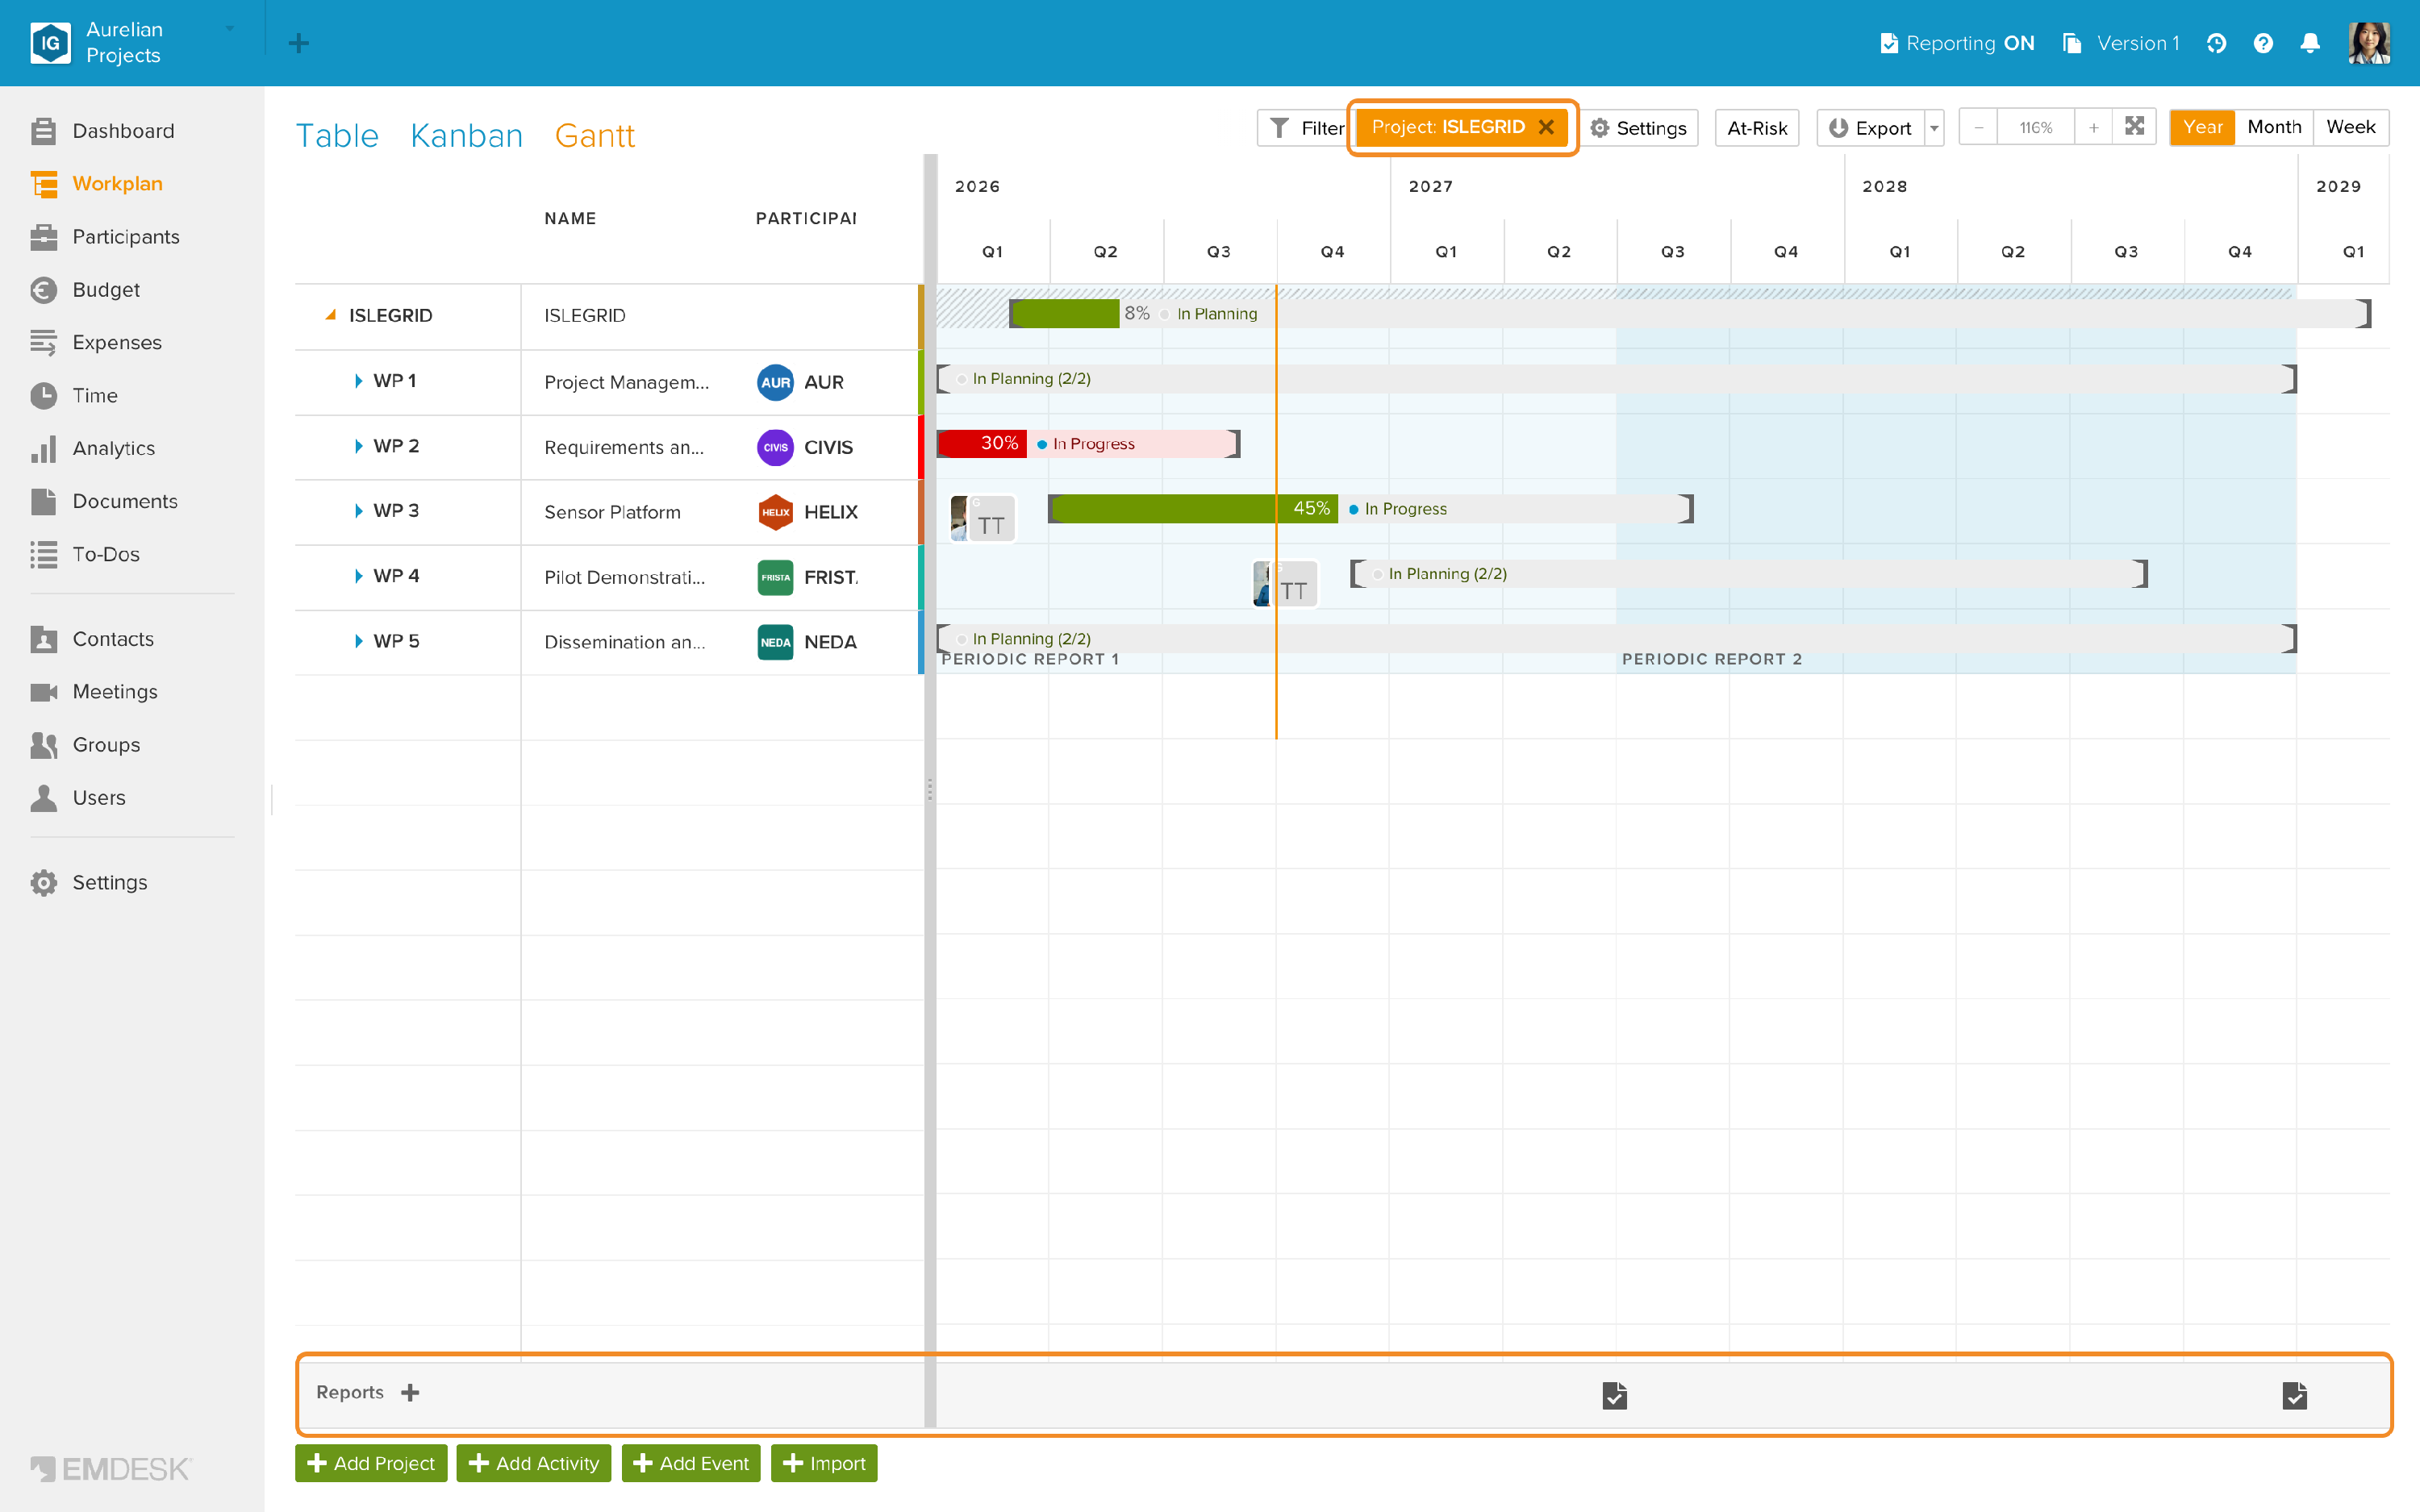
The Reports row at the bottom of the Gantt chart shows an icon for each report; Admins and Managers can click it to open the report. To see the periods themselves, show a single project: click Filter, choose the project under Project and click Apply. The timeline is then shaded per reporting period, labelled with the report names, so you can see at a glance which activities, deliverables and milestones fall into which period. The shading can be switched off with Reporting periods under Settings.
💡 Tip: When a period is closed and reported, you can lock expense, progress and time reporting up to its end date so that nobody changes the reported data by accident (see Disable reporting temporarily).
Deleting a reporting period
- Open the reporting period in the sidebar (Settings › General › Reports, Edit icon).
- Click the … button at the top right of the sidebar and select Delete. (Duplicate creates a copy.)
⚠️ Note: Deleting a reporting period does not delete any data such as expenses or status updates. It only removes the period itself: it disappears from filters and views, and data that was linked to it is no longer associated with it.